Last updated: 2025-06-11
Source: https://msp.support.freshservice.com/support/solutions/articles/50000011306-agent-performance
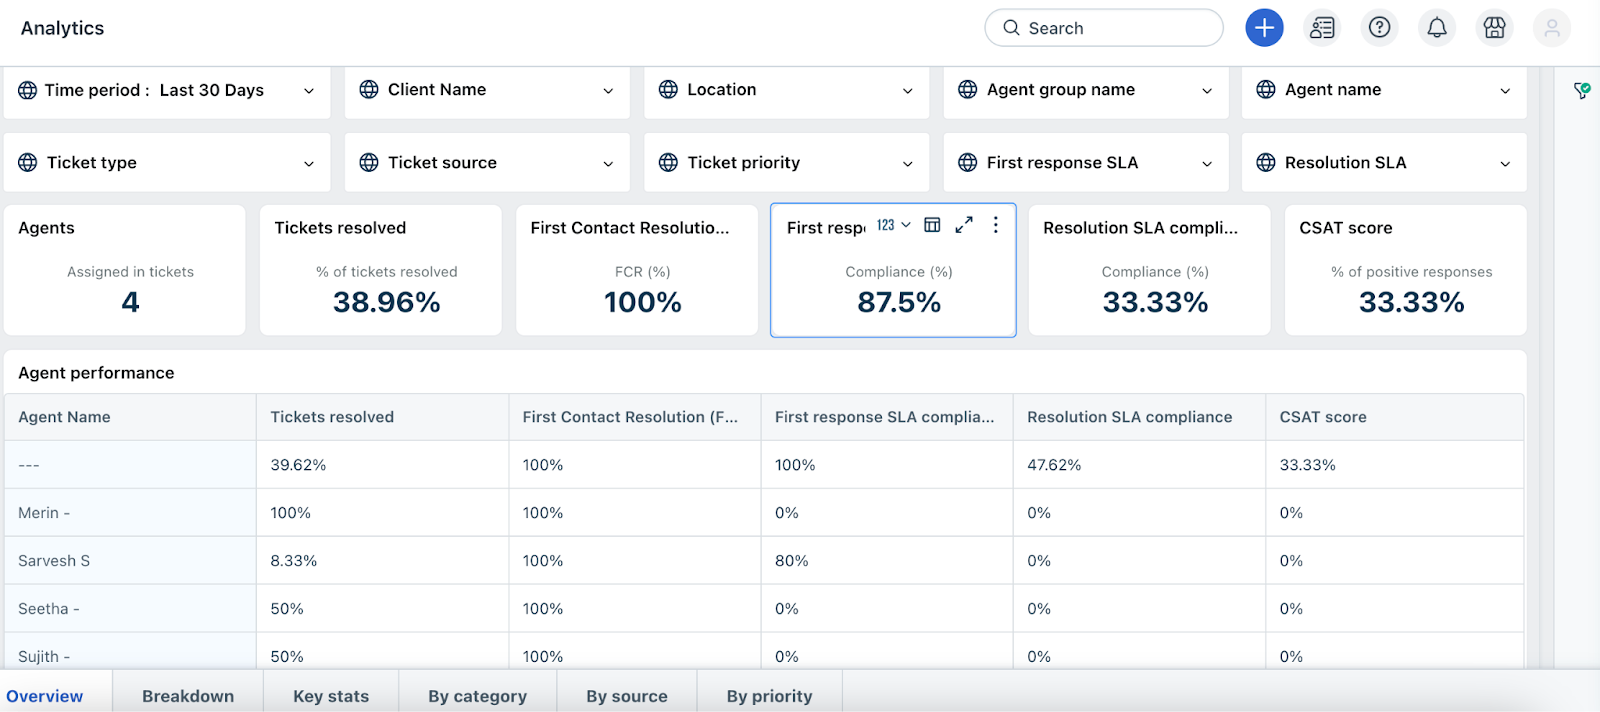
The Agent Performance report evaluates the efficiency of individual agents in handling tickets across clients. It provides a comprehensive comparison of key service metrics, enabling data-driven performance assessments.
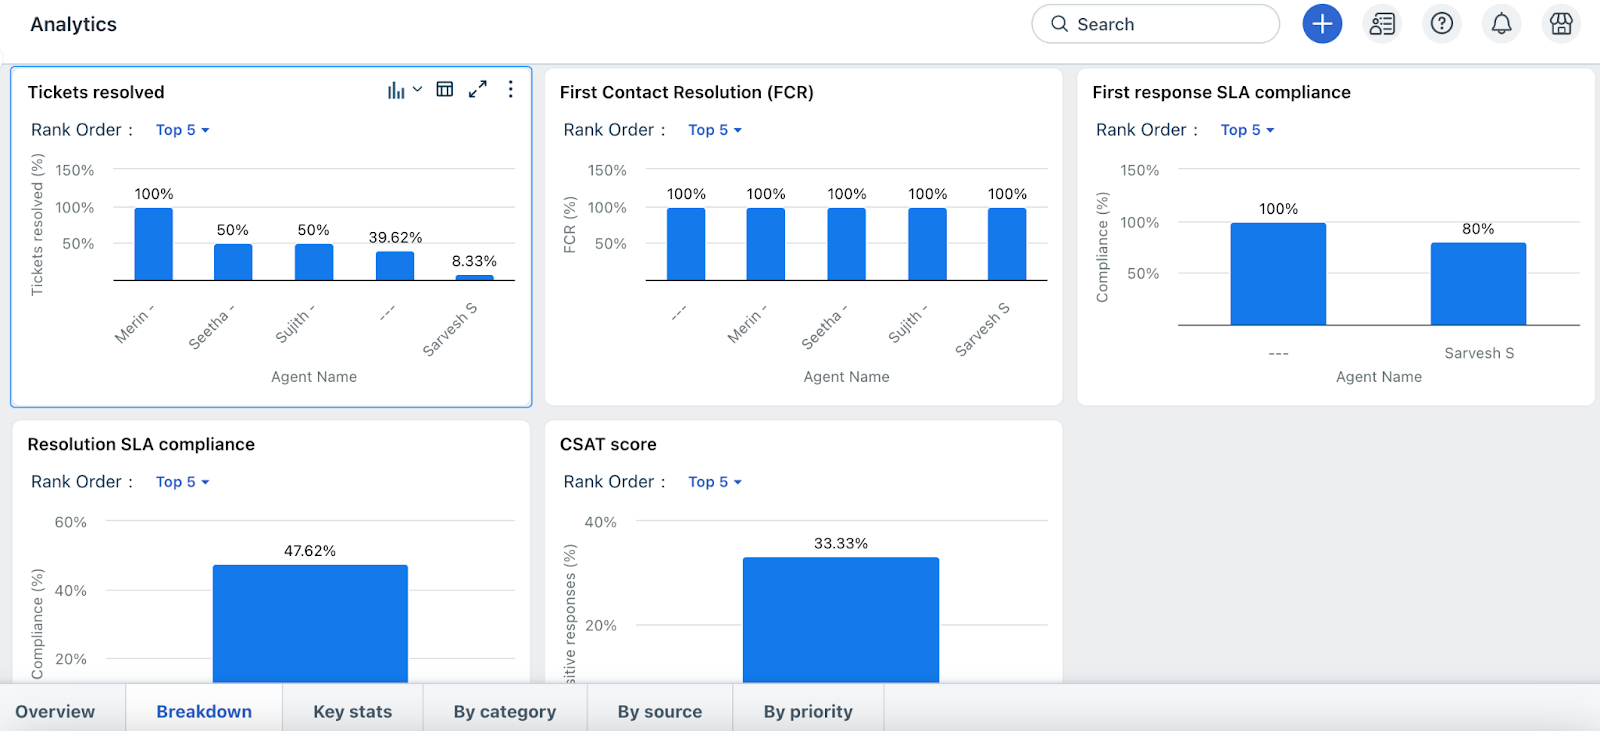
You can track each agent’s performance across the following five metrics:
Percentage of tickets successfully resolved by the agent.
Measures the percentage of tickets resolved during the first interaction.
Indicates how often the agent met the SLA for initial response times.
Reflects the percentage of tickets resolved within the SLA-defined timeline.
Percentage of positive customer satisfaction survey responses attributed to the agent.
This view allows you to easily compare the performance of all agents side by side, helping identify top performers and areas that may need attention or support.
Accessing curated reports
To access the report:
Tabs available in curated reports
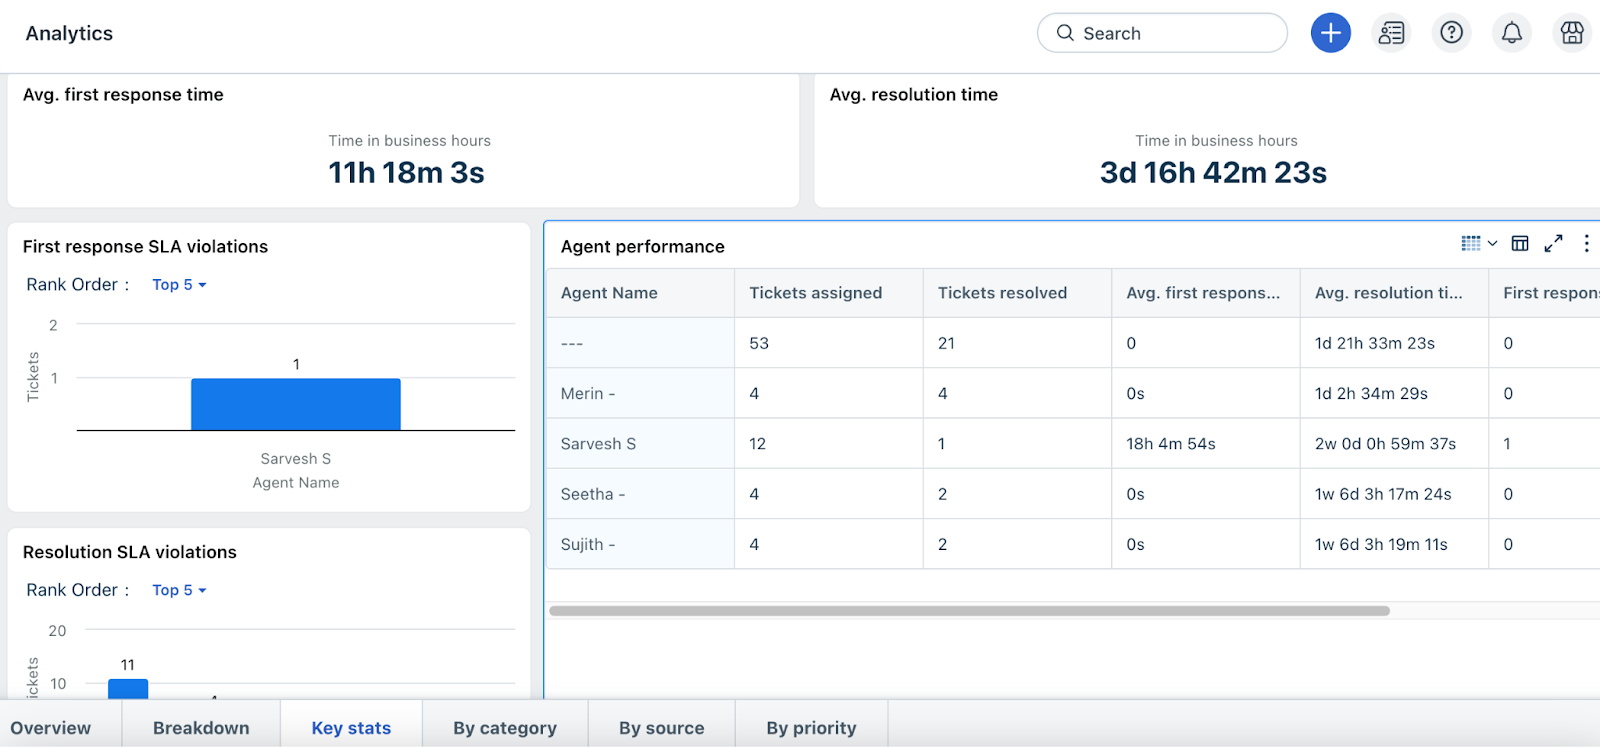
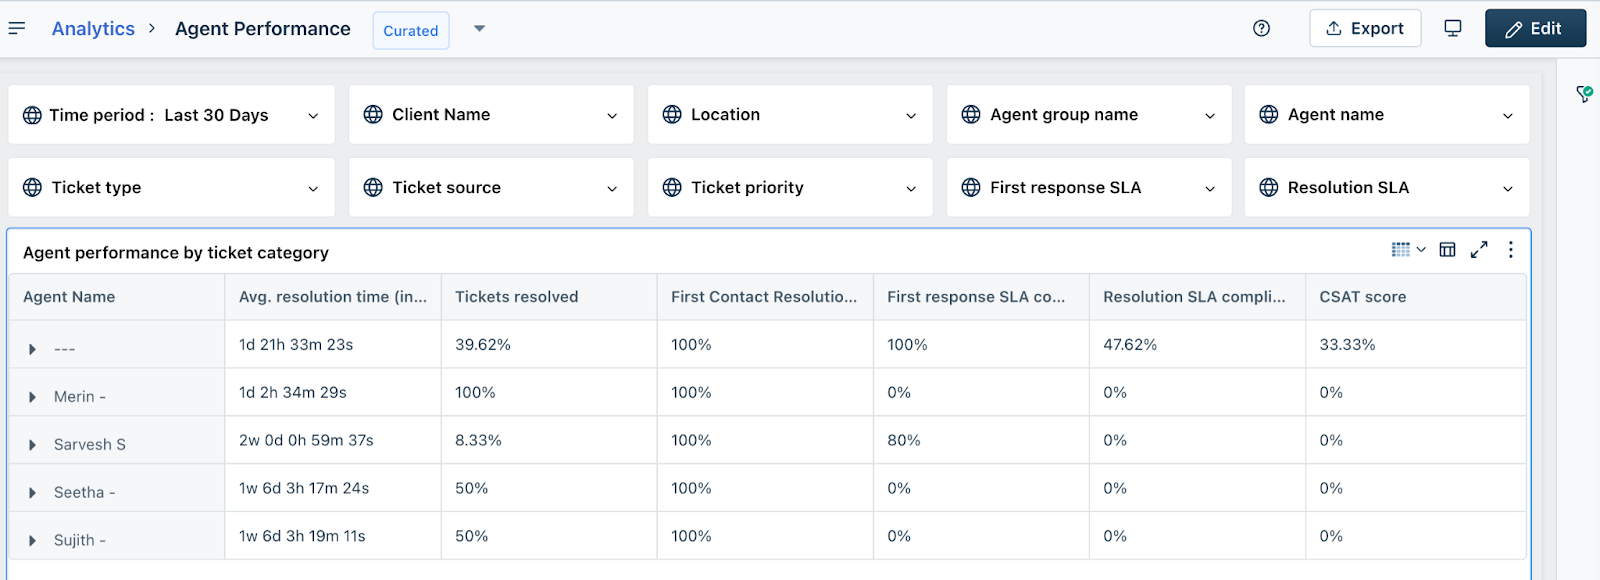
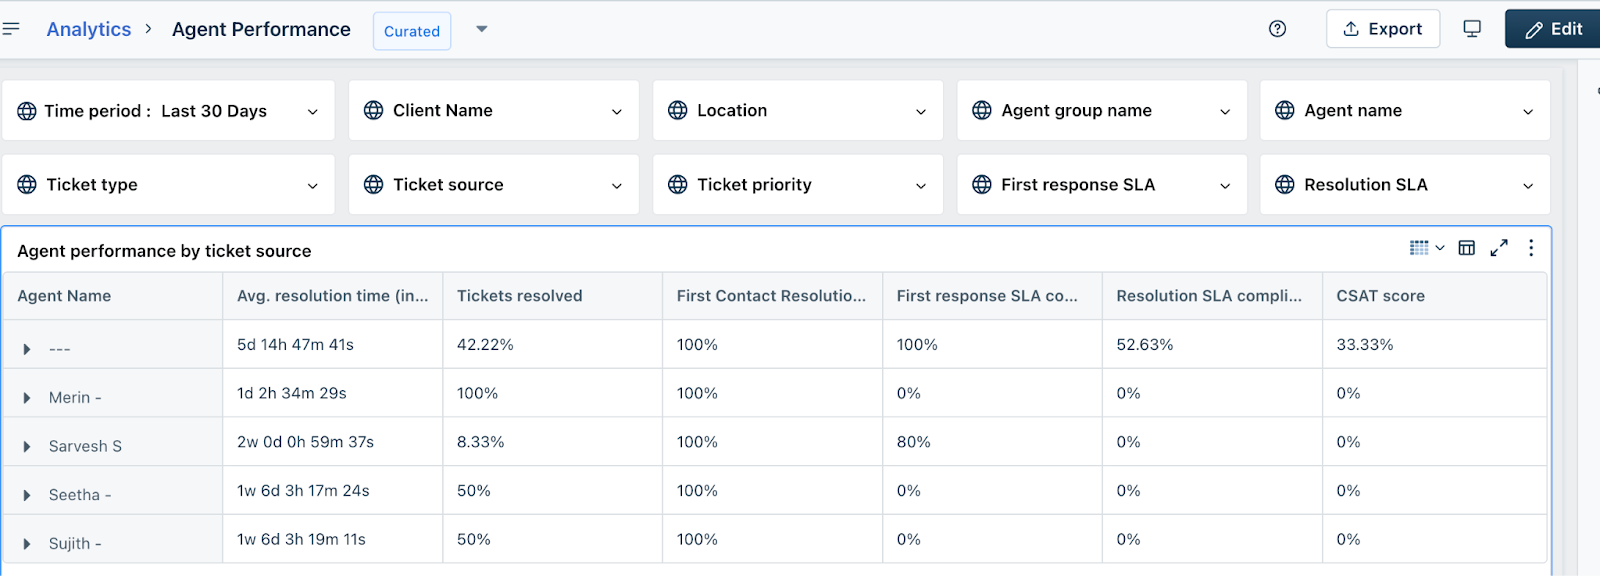
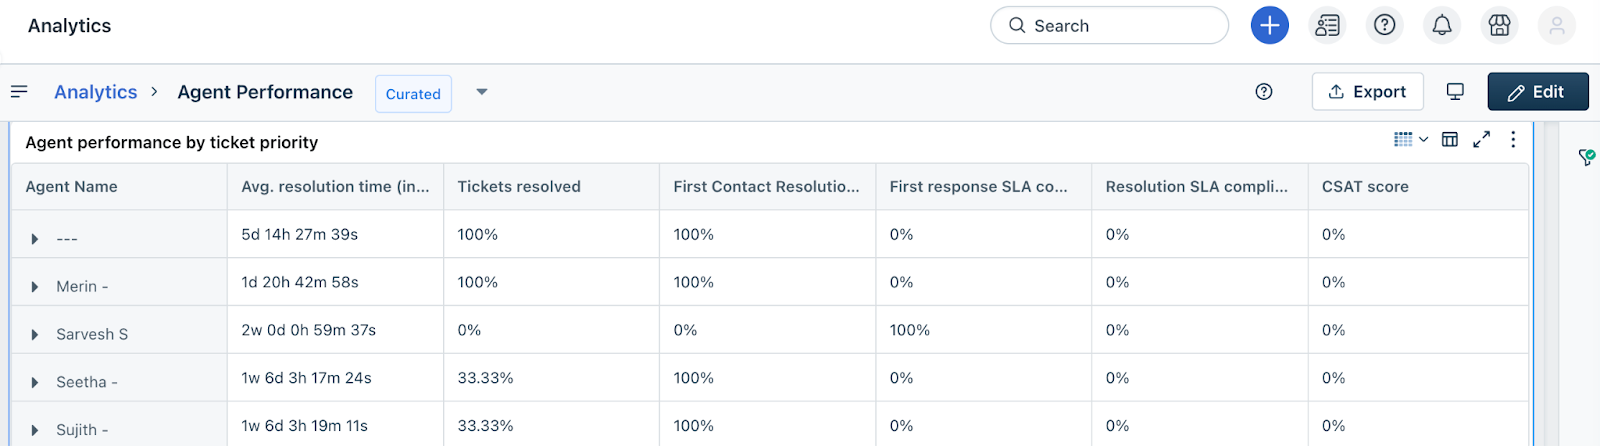
Following is the list of all tabs available inside the curated report:
Work with global filters
Curated reports come with predefined filters across all tabs that help you narrow down data to suit your analysis needs. Below is a list of available filter types, their descriptions, and the possible values you can use.
| Filter Type | Description | Available Values |
| Time Period | Defines the date range for the data displayed in the report. | Set a custom date or select a predefined range: last 7 days, 30 days, month, quarter, or year. |
| Client Name | Filters data by specific clients in your account. | List of all active client names. |
| Location | Filters tickets based on location metadata. | All available locations in your account. |
| Agent Group Name | Filters tickets handled by specific agent groups. | All agent group names in the account. |
| Agent Name | Filters tickets handled by individual agents. | All agent names in the account. |
| Ticket Type | Filters based on the type of ticket. | Incident |
| Ticket Source | Filters based on the source channel from which the ticket originated. | AWS CloudWatch, Alerts, and other integrated channels. |
| Ticket Priority | Filters tickets by their assigned priority level. | High, Medium, Low, Urgent |
| First Response SLA Compliance | Shows whether the first response met the defined SLA. | Within SLA, SLA Violated |
| Response SLA Compliance | Indicates compliance status of response SLAs. | Within SLA, SLA Violated |
Report overview
The reports overview provides a consolidated summary of agent performance across key service desk metrics.
This overview includes the following key performance indicators:
Total number of agents who have been assigned tickets during the selected time period.
Percentage of tickets resolved by agents, helping evaluate overall ticket closure efficiency.
Percentage of tickets resolved during the first interaction, indicating support quality and effectiveness.
Indicates the percentage of tickets where the initial response was provided within the SLA-defined time.
Percentage of tickets resolved within the defined SLA, highlighting adherence to service standards.
Shows the percentage of positive customer satisfaction responses received through feedback surveys.
You can view these metrics at the individual agent level to analyze performance and identify areas for recognition or improvement.
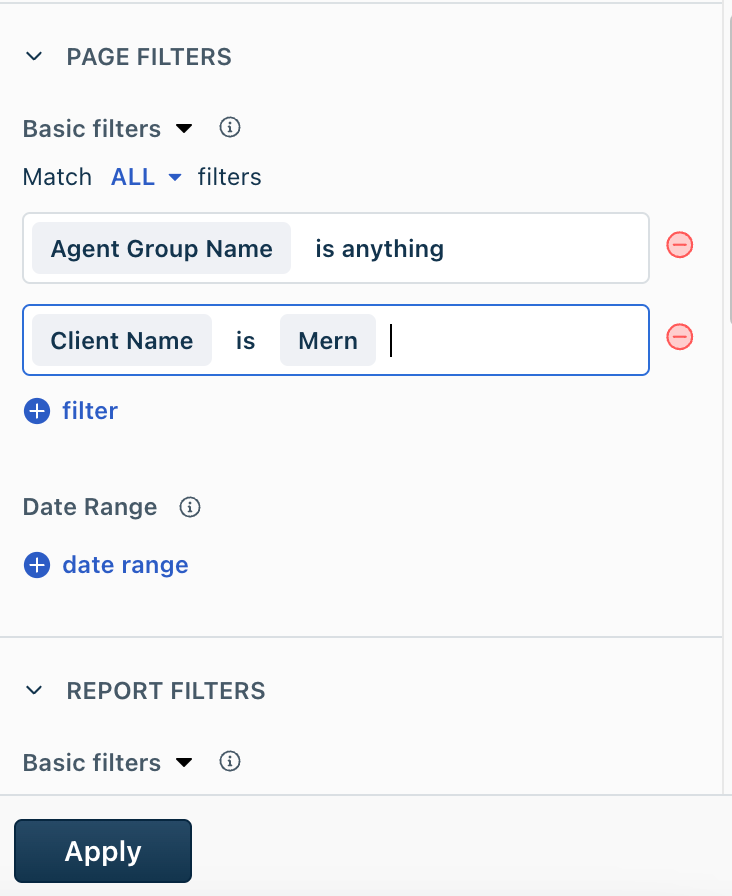
Apply filter
Click Edit and apply the following filters on the report based on your requirement:
Edit a widget
To edit a widget, hover over a widget in any of the tabs and you can perform the following actions.
| Action | Description |
| Change visualization | Change is the display to map, chart or table based on your requirement |
| Underlying data | Opens the widget data in a dialog box.<br>- Use the Filter button to filter the data based on the available metrics.<br> <br>- Use the Export button to export the data in CSV, XLSX format, and so on. |
| Expand | Expands the widget view. |
| More options | Shows more options, such as filters applied, schedule, subscribe, and so on. |