Last updated: 2026-01-23
Freddy Copilot is designed to enhance agent productivity by freeing up their time for high value work. With numerous Freddy Copilot features available to use, tracking their overall usage and impact can become complex.
The introduction of Freddy Copilot reporting aims to provide insights into agents' usage trends and the impact of Freddy Copilot on your service desk metrics.
The Freddy AI Copilot Overview curated report is accessible to all accounts that have purchased at least one Copilot license. As these usage reports are at the user level, Freddy Copilot reports are visible to all individuals within the organisation with access to User reports.
This article provides information on:
Accessing curated reports
To access the Freddy AI Copilot Overviewreport:
Following is the list of all tabs available inside the curated report:
Note: In each of the Freddy AICopilot Overview tabs and corresponding widgets, the reporting data can be displayed in a number, tabular, or graphical format.
When you hover over each widget of a tab; for example, _Adoption Trends_ widget in the Adoption tab, you will see various icons in the widget, which allow you to modify the view, expand the view, download, export, and so on (as shown in the image below).
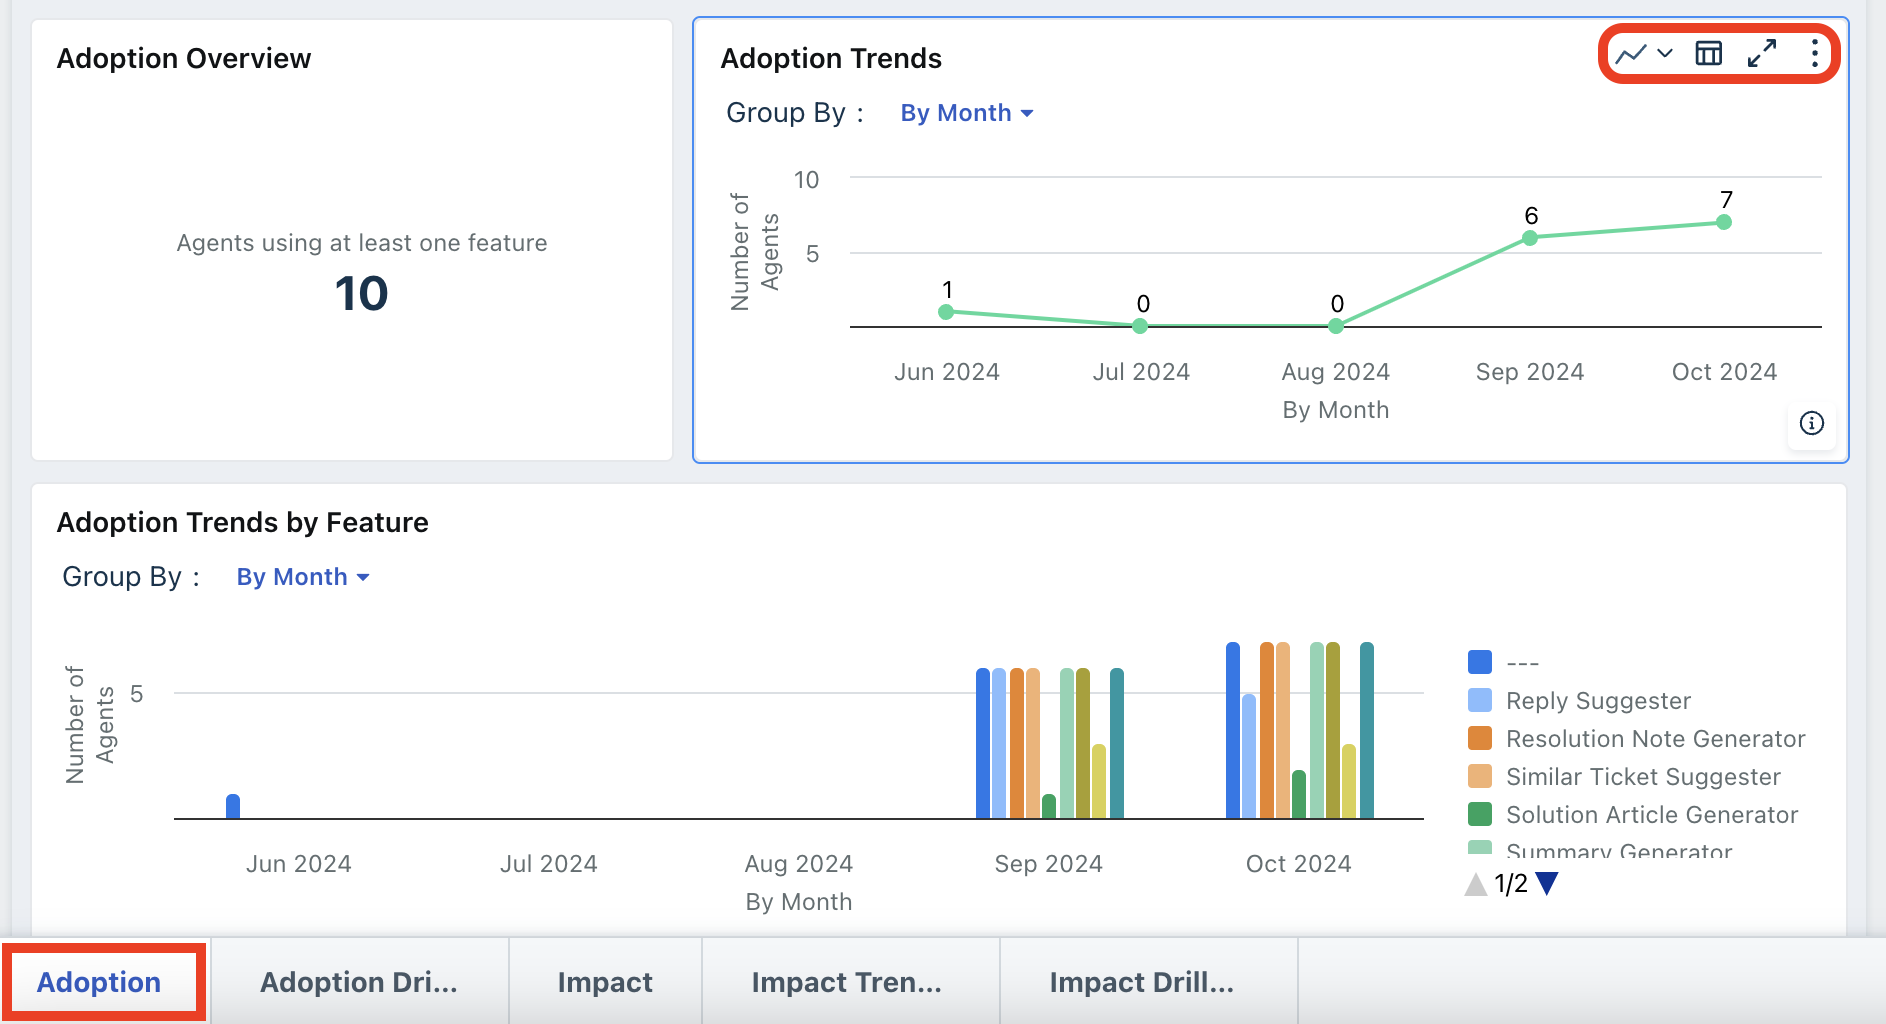
Icon and dropdown descriptions
| Icon or dropdown | Description |
|---|---|
 (or, similar dropdown icon) (or, similar dropdown icon) | Allows you to view the widget in _Number_, _Tabular_, or _Summary Table_ format. |
 (or, similar dropdown icon) (or, similar dropdown icon) | Allows you to view the widget in _Bar_, _Chart_, _Bar Chart_, _Tabular_, _Heat Map_, _Matrix Table_, or _Summary Table_ format. |
 | Opens the widget data in a dialog box.<br>- Use the Filter button to filter the data based on Time Period, Name, Emails, and so on.<br>- Use the Export button to export the data in CSV, XLSX format, and so on.<br>- Click the X icon to close the dialog box. |
 | Expands the widget view.<br>- You can use the chart or table dropdown, underlying data, or options icon in the expanded view as well.<br>- Use the star icon to add the data to favorites.<br>- Click the left arrow icon to go back to the tab view. |
 | Shows more options, such as filters applied, schedule, subscribe, and so on. |
| Group By | Use the dropdown corresponding to Group By to group the data based on time period, such as date, month, or week; or based on name, time zone, created date, job title, user type, requester group, and many more. |
 | Click this icon at the bottom to learn about a widget. |
Applying filters
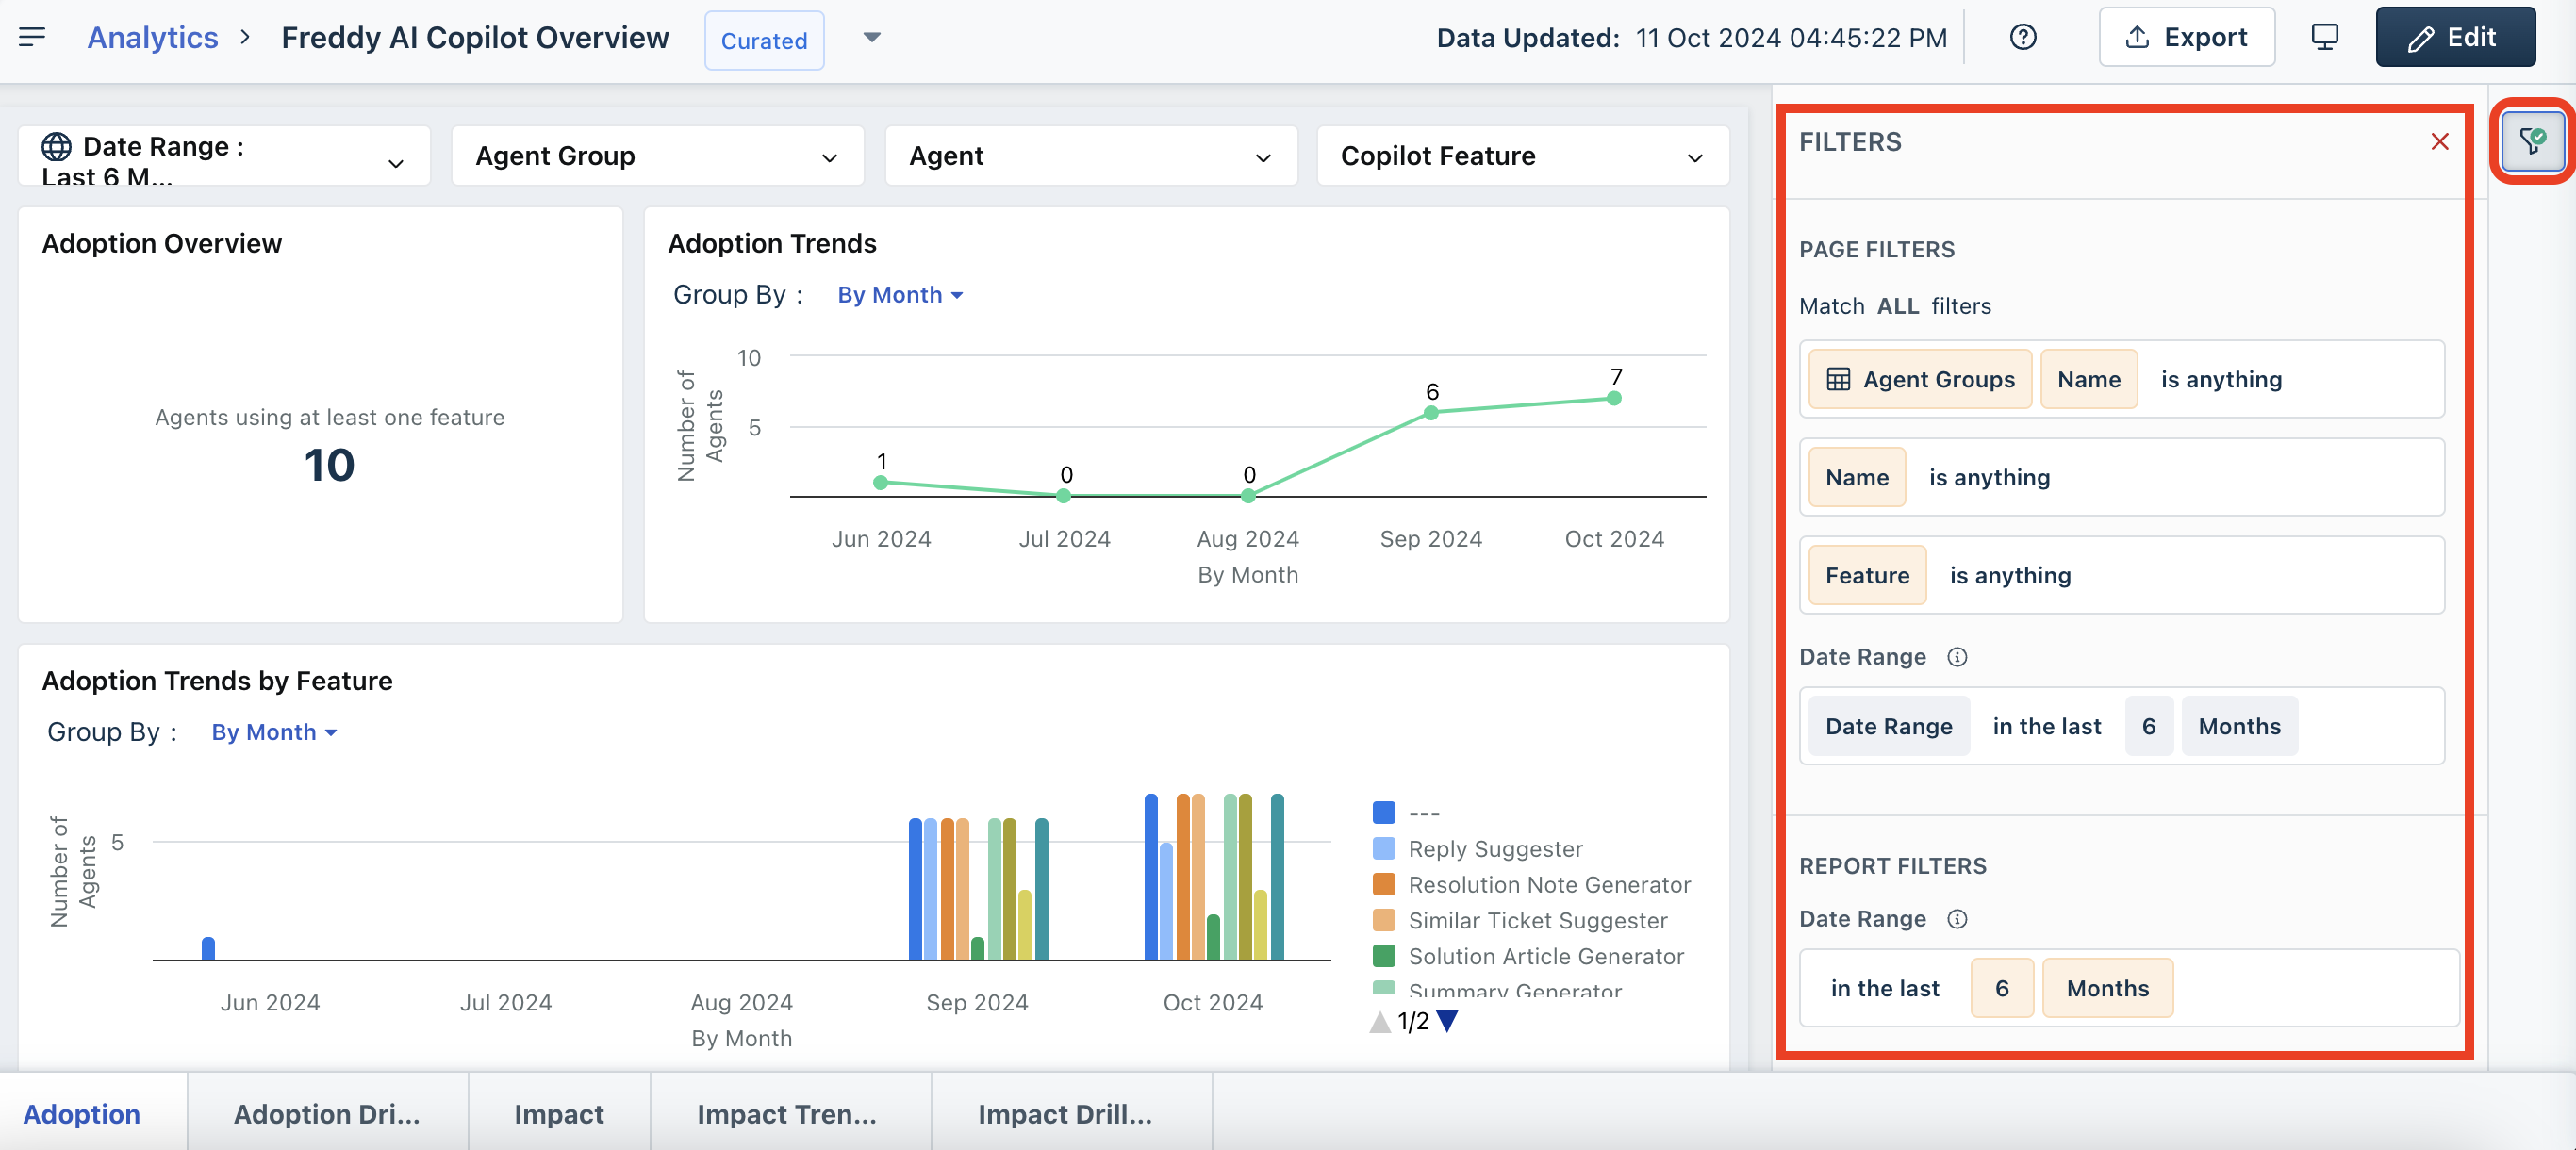
You can apply the following filters to view specific data in the widgets of any tab.
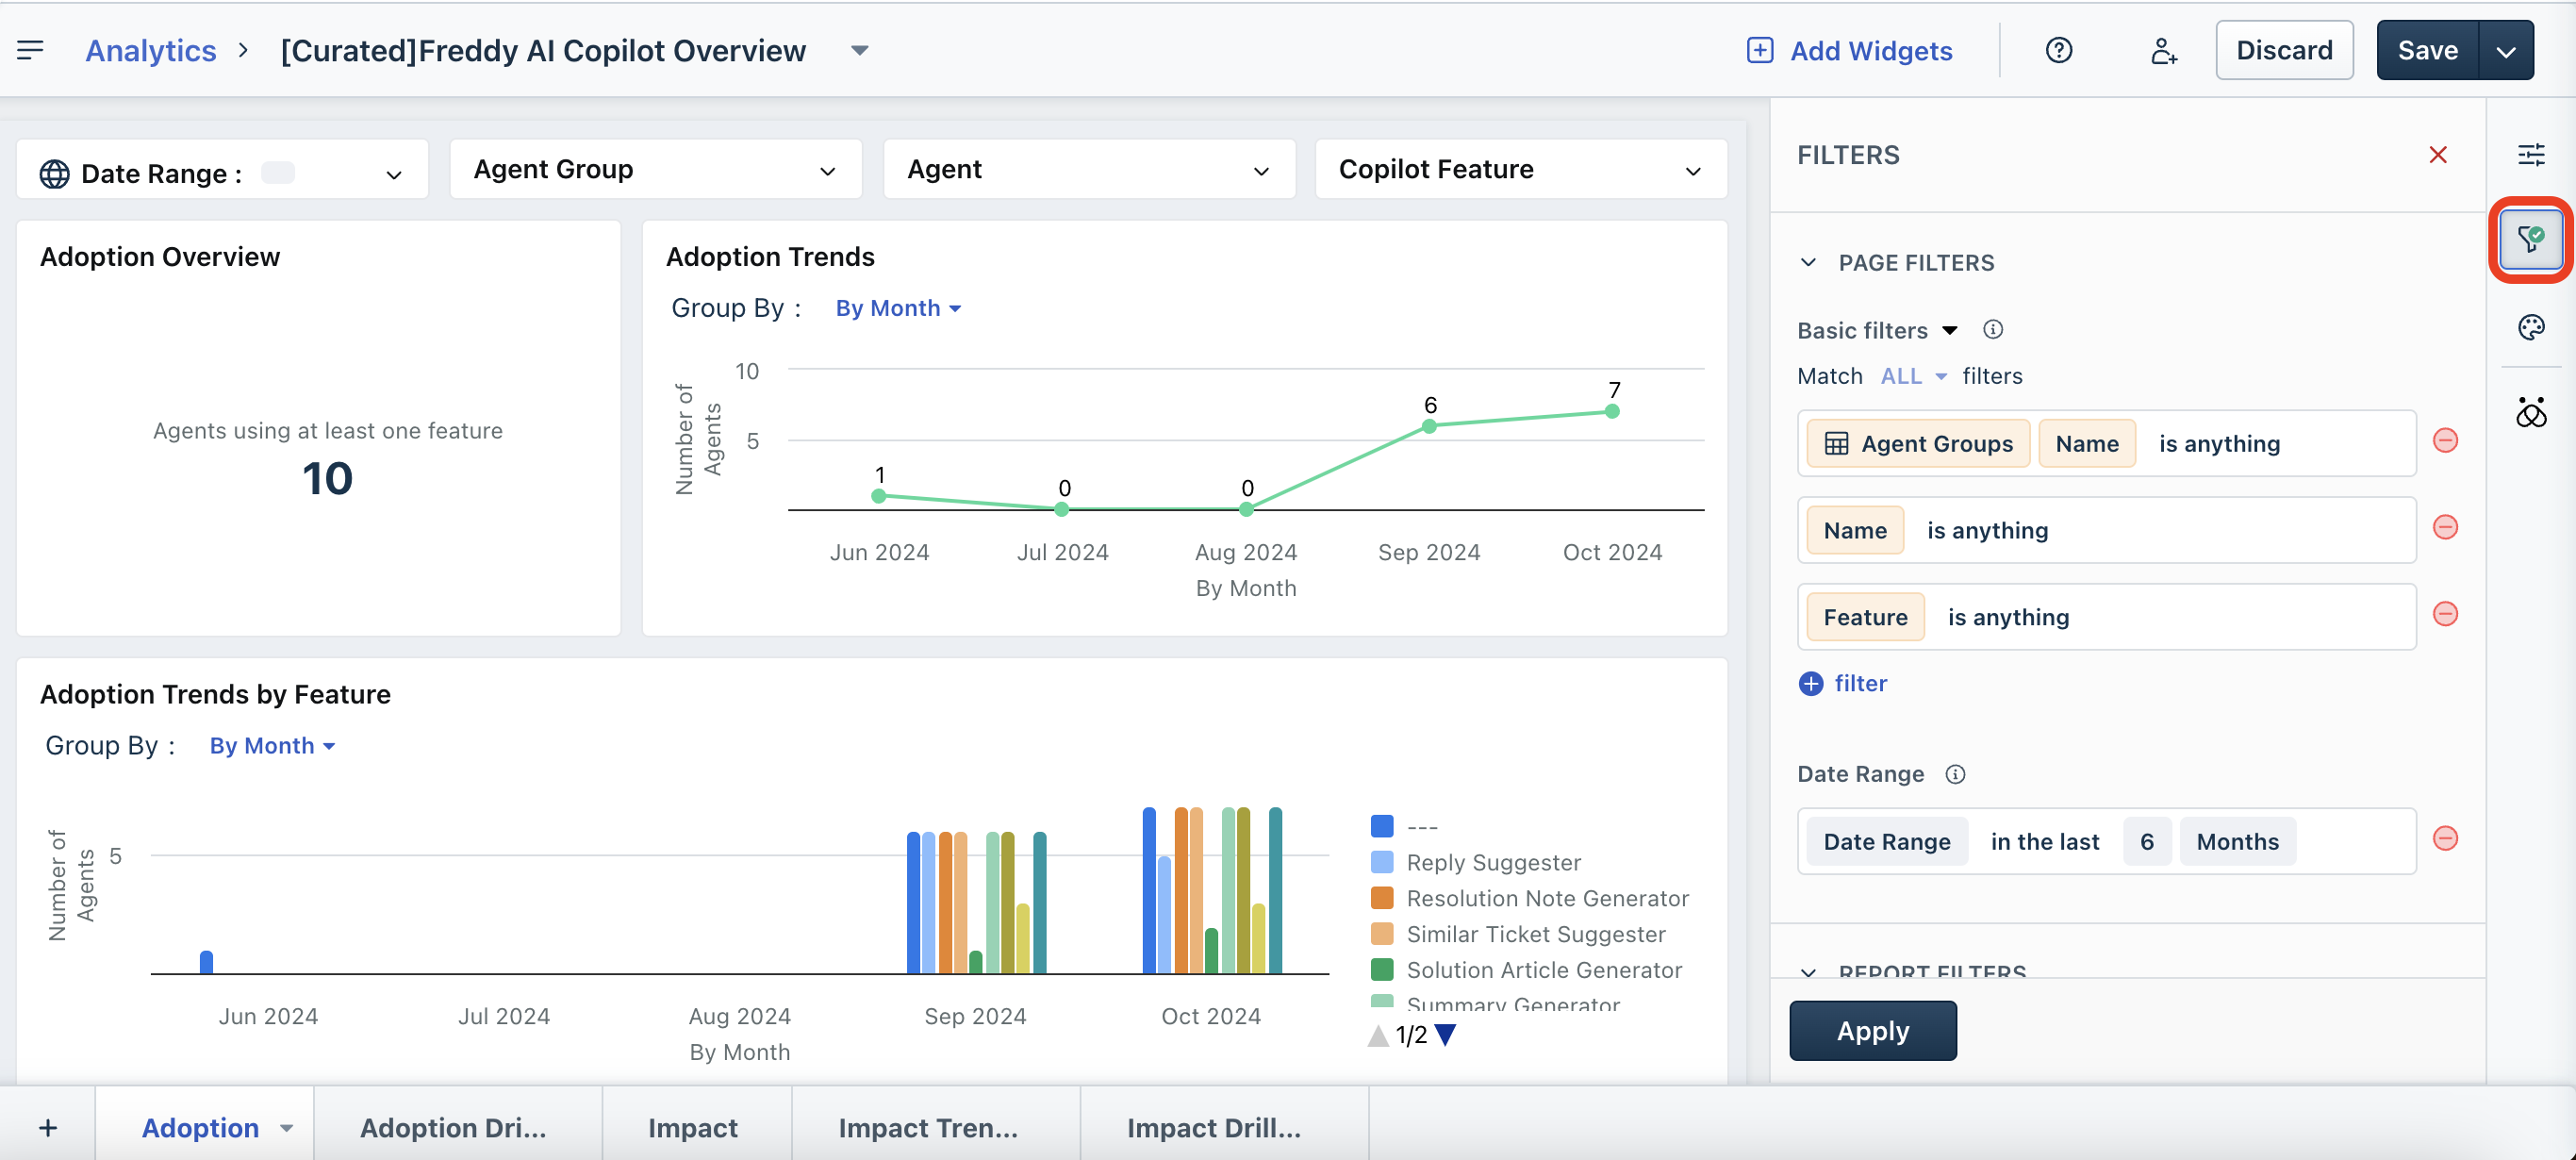
If you want to view the filters that are applied to widgets, click the Filter icon on the right. All the page filters are displayed.
Tracking metrics
You can track the following metrics and attributes with the Freddy AI Copilot Overview report.
| Metric / Attribute | Definition | Additional info |
| Metrics | ||
| Agents who used Freddy Copilot at least once (based on the user and copilot usage) | Number of agents who engaged with any Freddy Copilot feature at least once in the selected period | This count can be higher than the total number of purchased Copilot licenses due to agent reassignment during the selected period |
| Freddy Copilot Feature Usage (based on the copilot usage) | Number of times any of the Freddy Copilot features have been used in the given period by all agents | For Similar Incident Suggester and Ticket Field Suggester, number of views of the respective module is counted as a usage as these features do not require any manual intervention |
| Freddy Copilot Assisted Tickets (based on the copilot usage) | Number of tickets in which Freddy Copilot features have been used at least once | - This also considers the number of tickets in which Similar Incident Suggester or Ticket Field Suggester has given suggestions<br> <br>- This also count tickets impacted by any other Copilot features |
| Attributes | ||
| Copilot Feature | Refers to the name of the Freddy Copilot feature | Can be used to look at usage for any specific feature |
Viewing and understanding widgets
Adoption
The Adoption tab gives an overview of adoption observed for all Copilot Features in the account. This helps admins understand and report on Copilot usage.
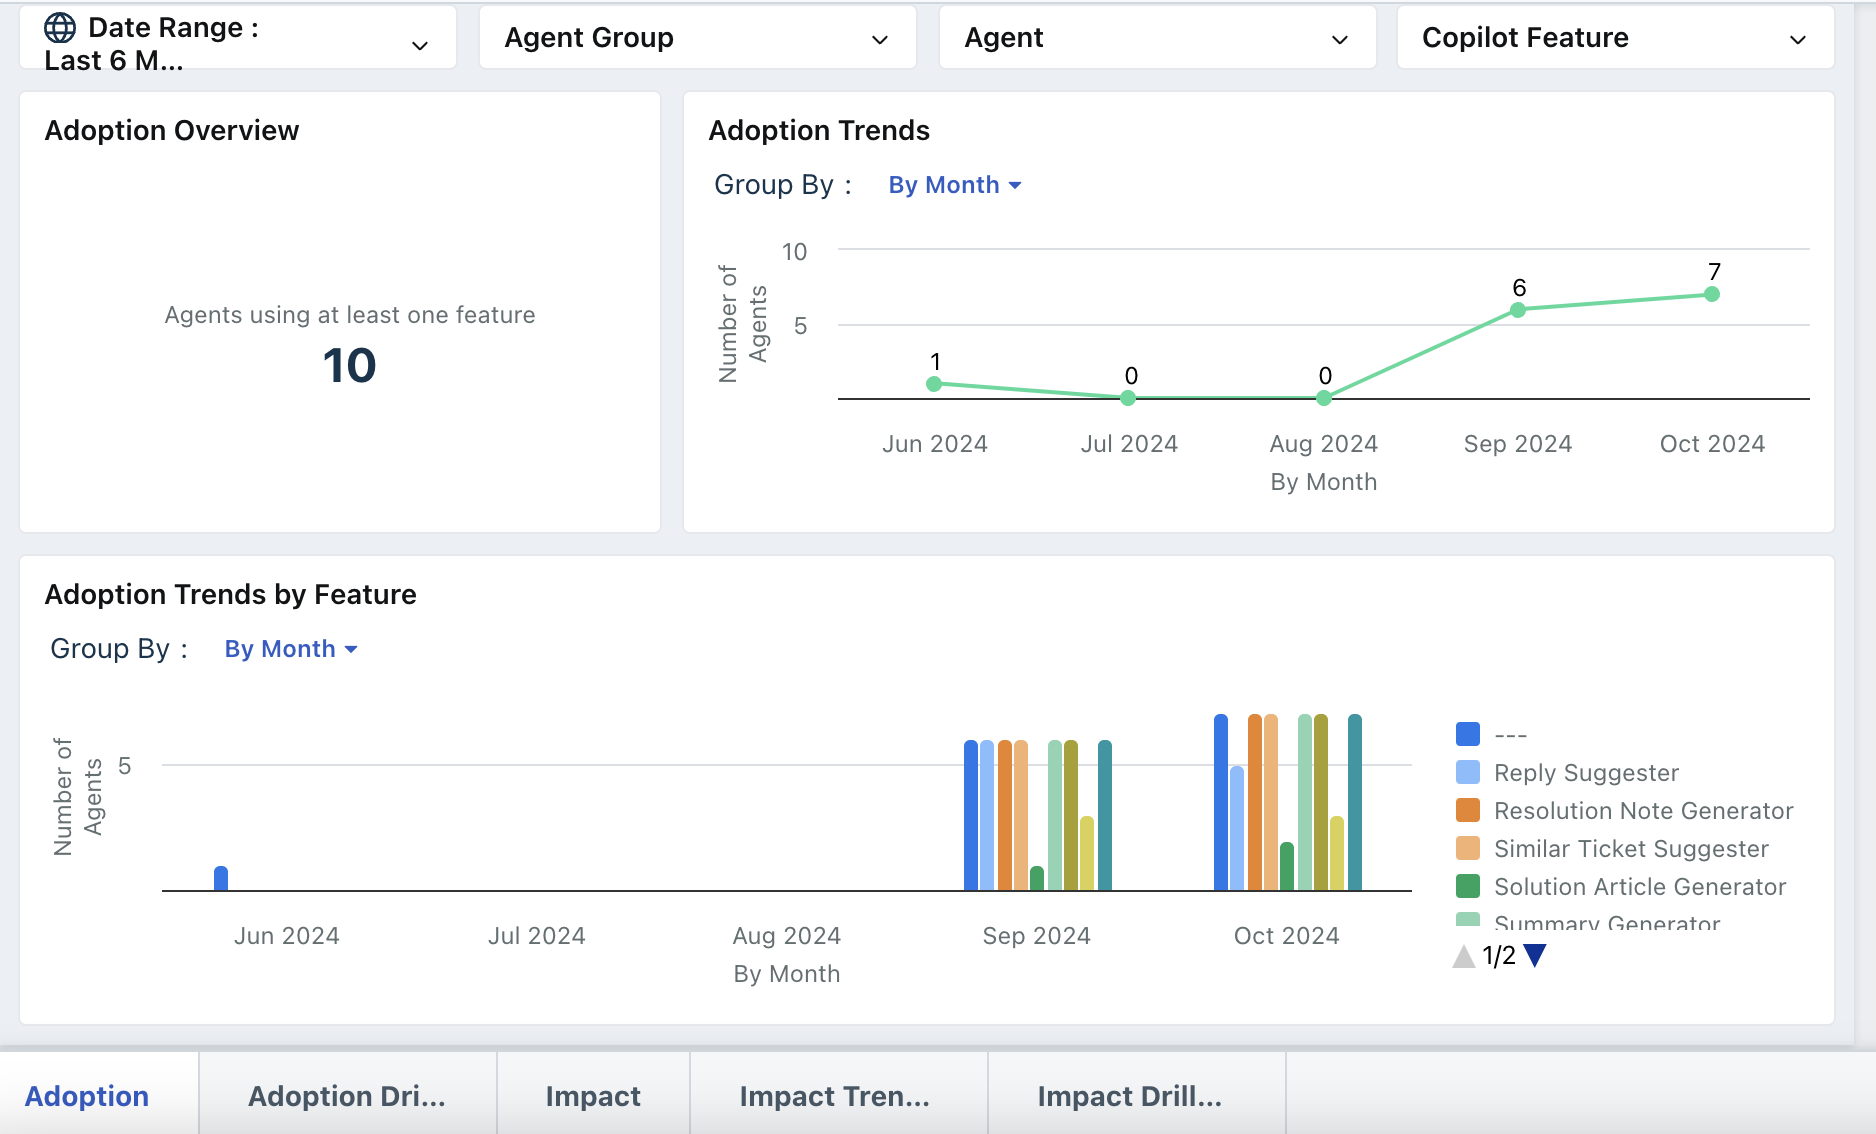
Here’s how you can use the widgets:
1. Adoption Overview: Track the number of licensed agents who have utilised at least one feature compared to licensed agents who have not used any features within the specified time frame. This count is specific to licensed agents (for Copilot) and does not reflect the overall agent count within the organisation.
2. Adoption Trends: Shows the usage trend of agents who have used at least one feature in the selected time period.
3. Adoption Trends by Feature: Shows the Copilot feature usage trend in the given time period.
Adoption Drilldown
The Adoption Drilldown tab gives a more detailed view of agent-level or feature-level usage of the Copilot features.
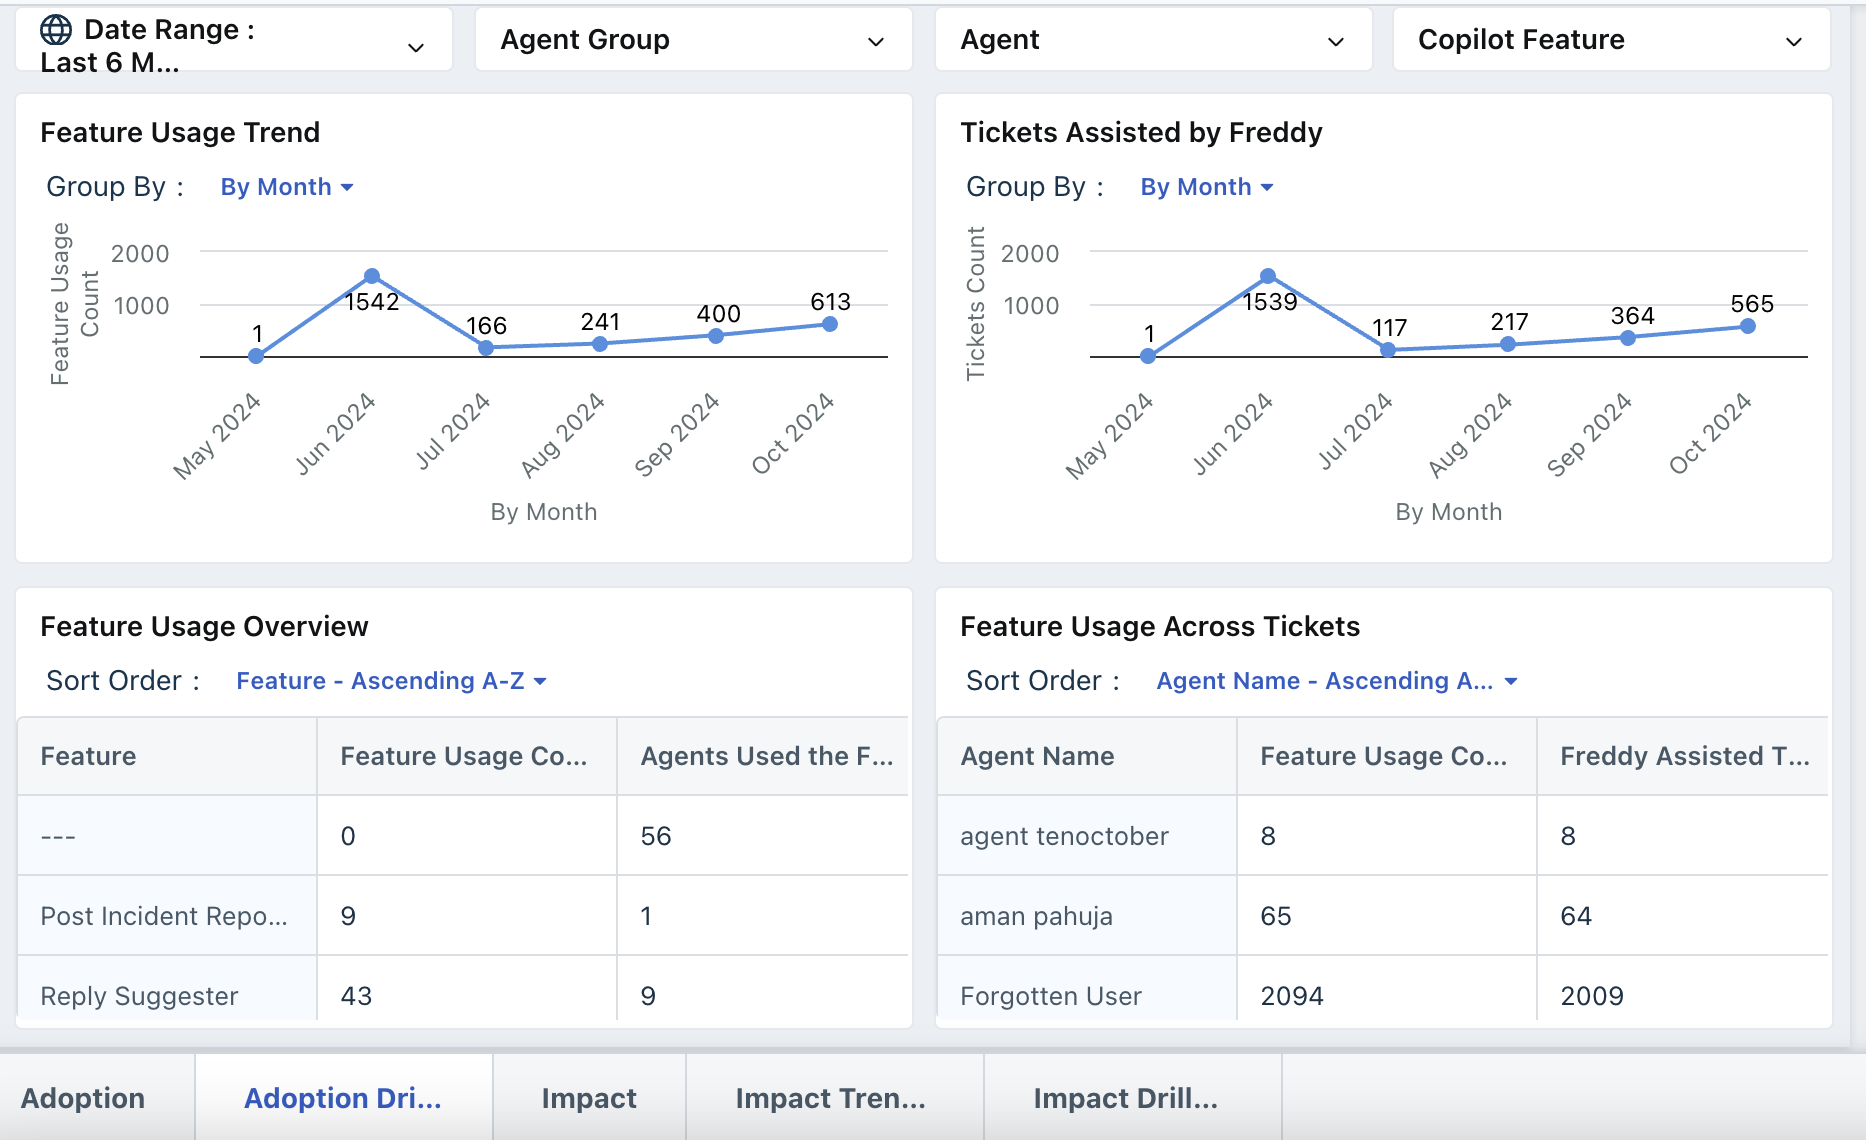
Here’s how you can use the widgets:
1. Feature Usage Trends: Shows the feature usage count for the selected time period.
2. Feature Usage Overview: Shows the feature usage overview by feature usage count and agents who used a feature. Gives you the option to sort the order of features.
3. Tickets Assisted by Freddy: This metric presents the count of tickets that have involved Freddy Copilot feature, indicating the number of tickets that have benefitted from Freddy's support.
4. Feature Usage Across Tickets: Shows the feature usage across tickets by agent name, feature usage count, and Freddy assisted tickets. Gives you the option to sort the order of agents.
Impact
The Impact tab helps you understand the overall business impact that Freddy Copilot is unlocking across critical service desk metrics. You can track this for licensed agents and unlicensed agents to compare and contrast.
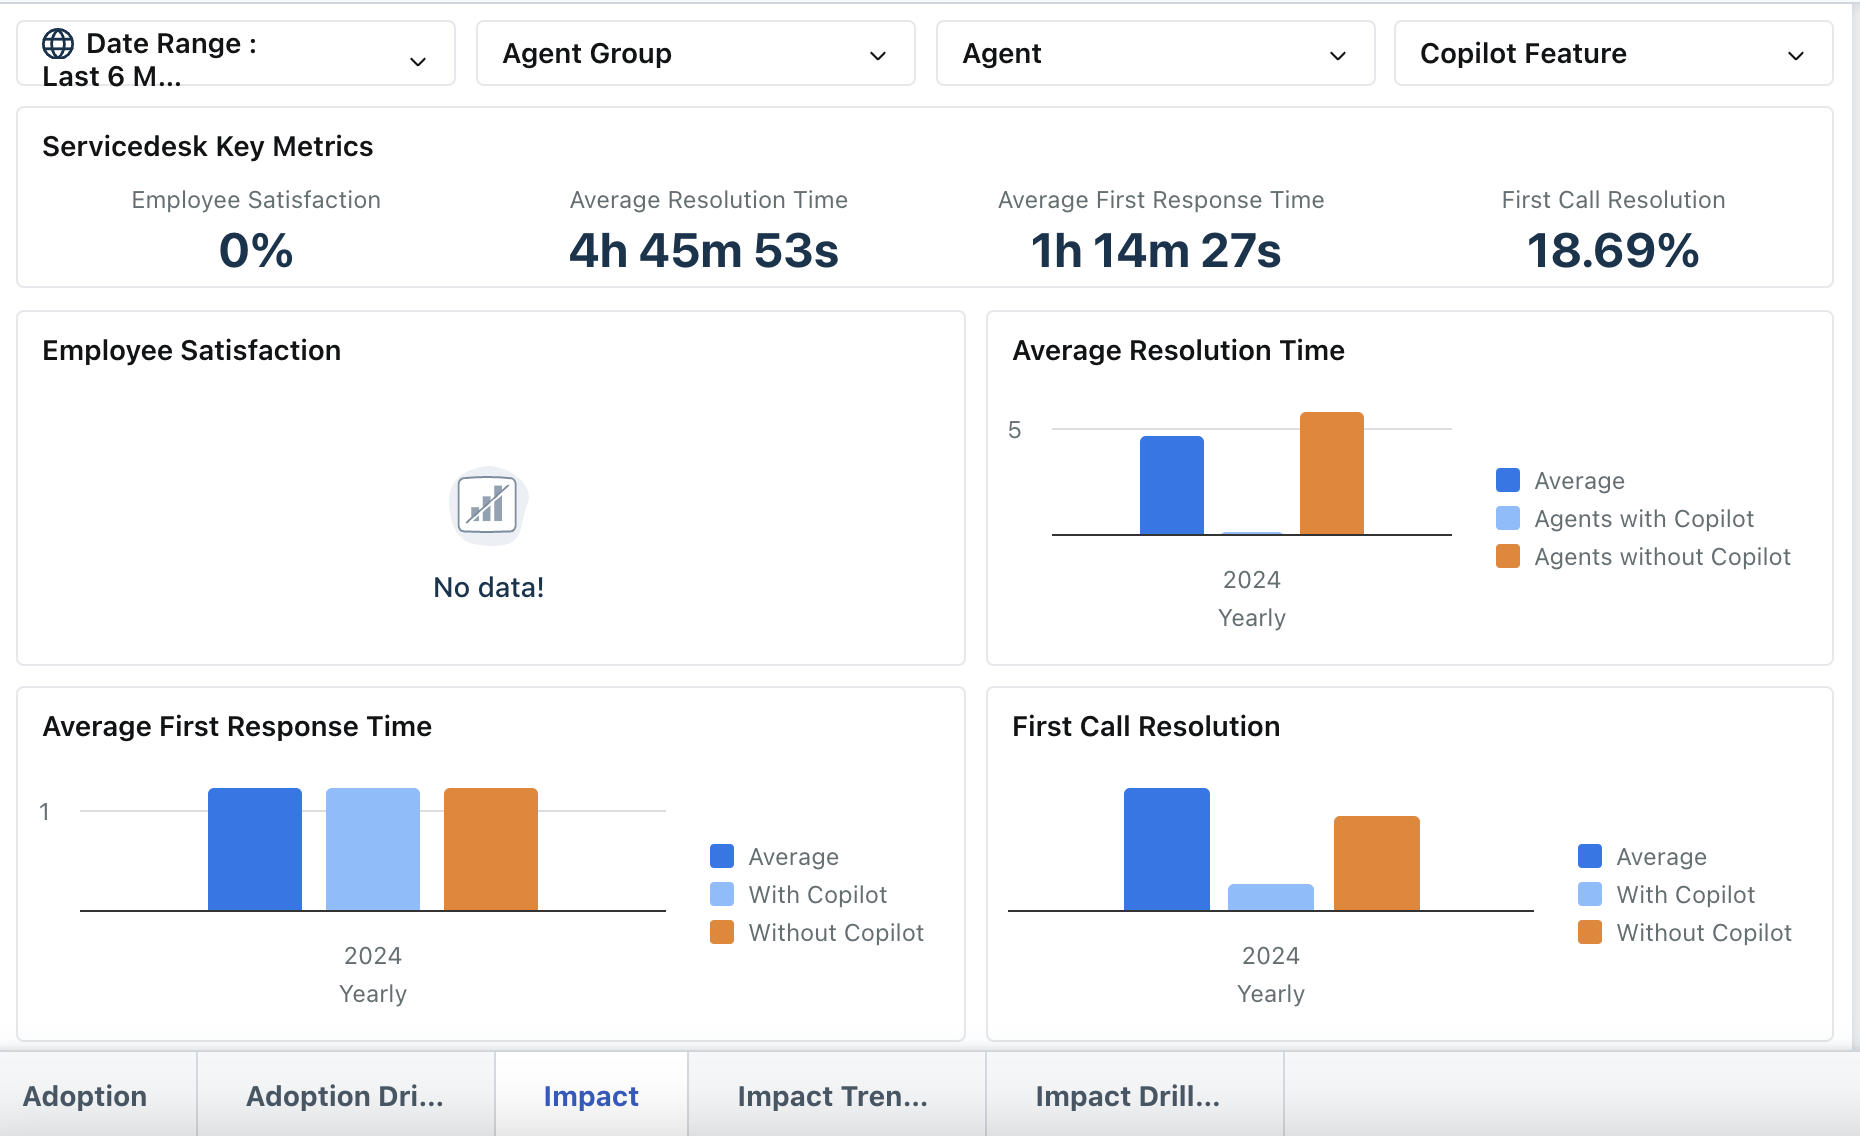
Here’s how you can use the widgets:
1. Track the key service desk metrics that are impacted by Freddy Copilot and the increase or decrease observed on Employee Satisfaction, Average Resolution Time, Average Response Time, and First Call Resolution.
2. Each of these metrics can be observed in individual widgets to track their current average and usage for licensed and unlicensed agents.
3. You can also create your own widgets using these properties for other specific metrics.
Impact Trendline
The Impact Trendline tab helps you observe the trends in service desk metrics over a time period as impacted by Freddy Copilot.
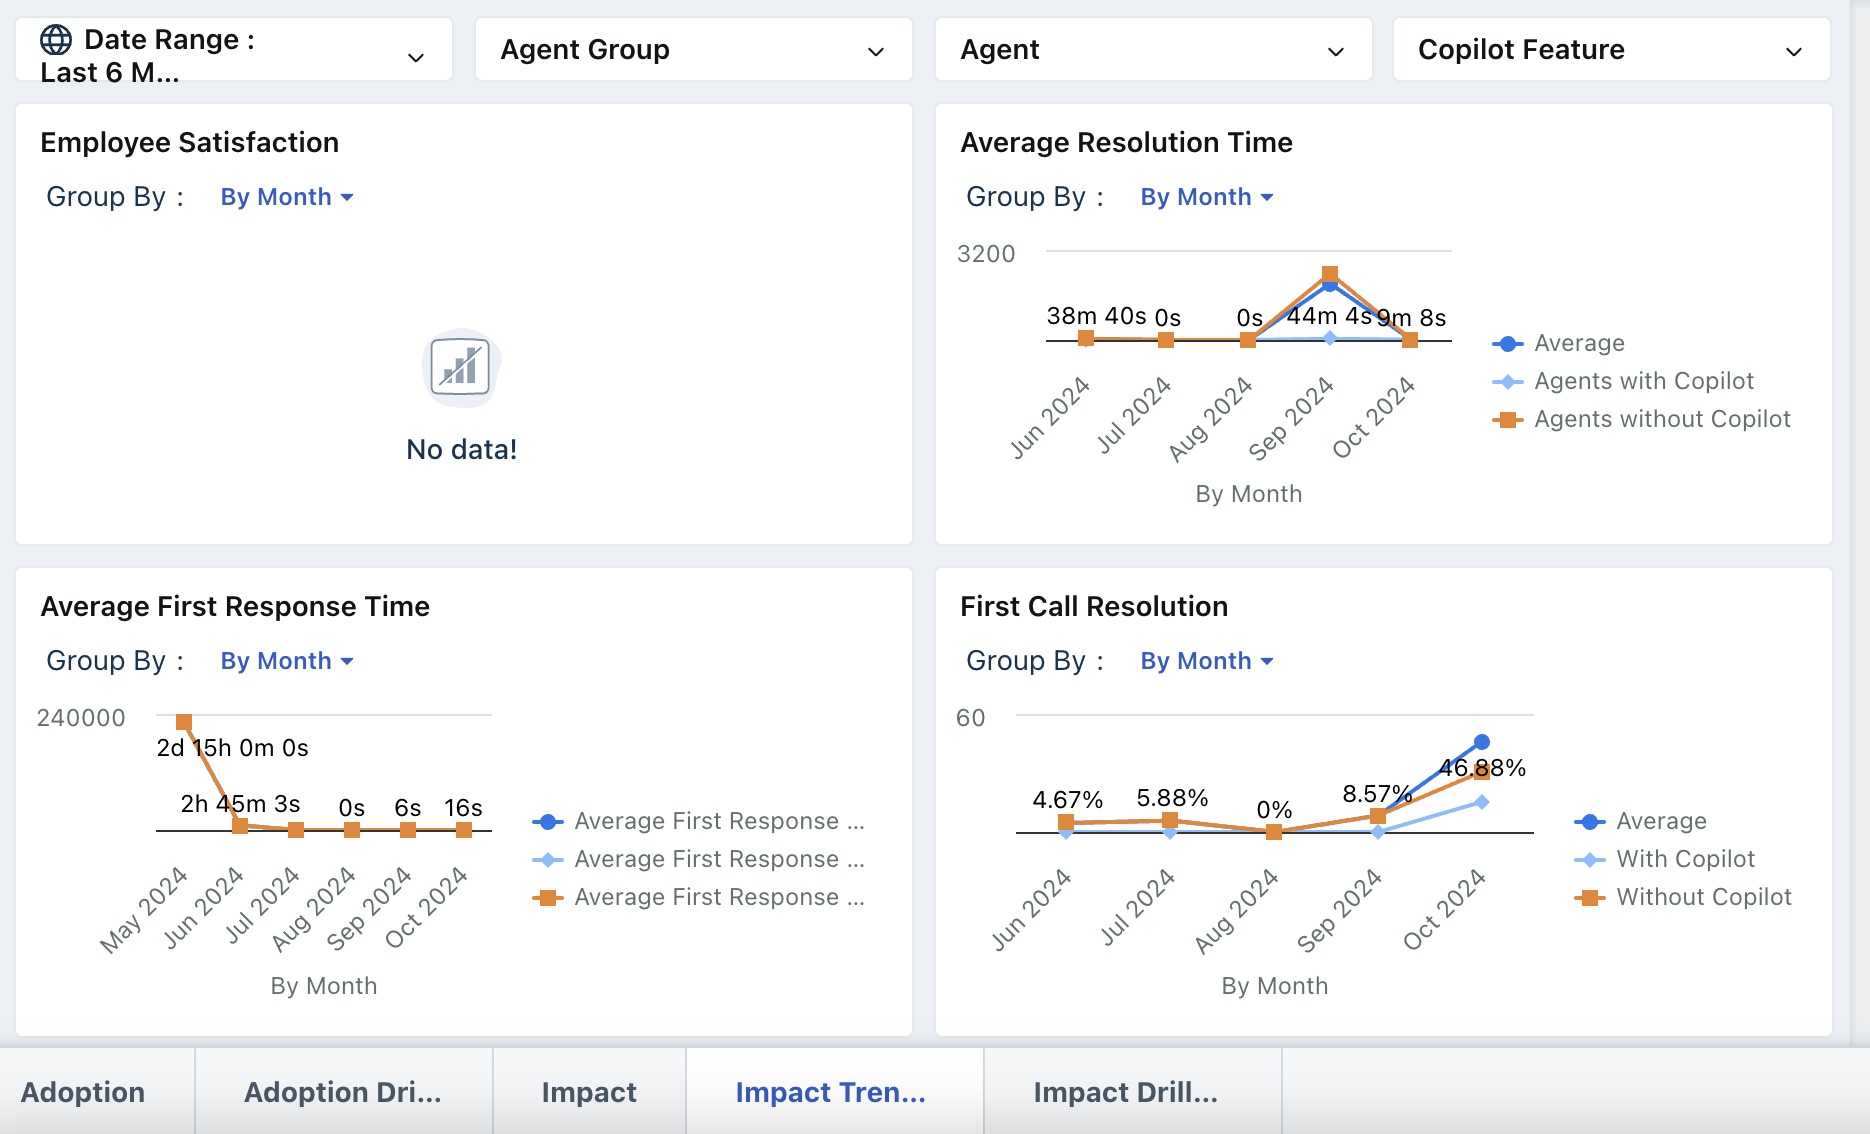
Impact Drilldown
The Impact Drilldown tab helps you understand the impact driven by Freddy Copilot on agent groups across key service desk metrics.
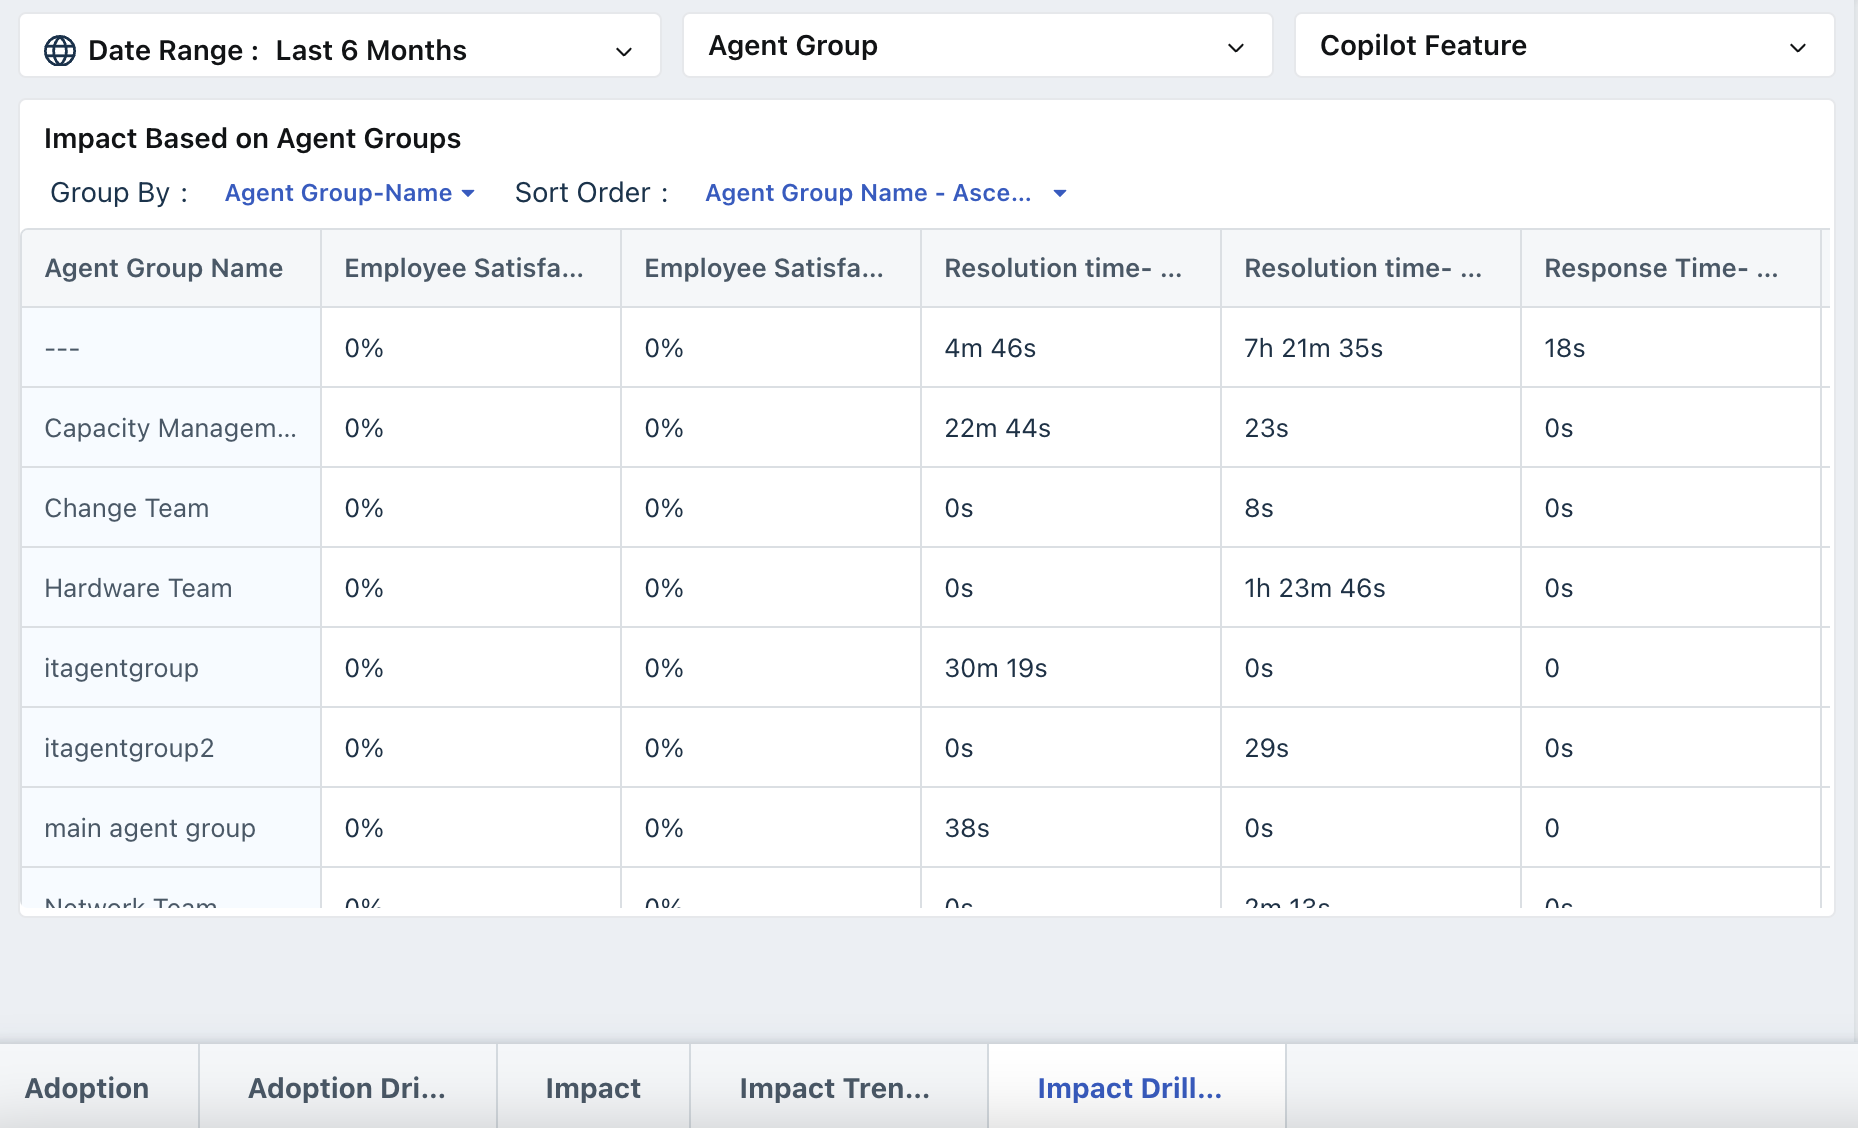
Managing the report
You can manage the report by viewing report details, cloning, deleting, sharing, exporting, presenting, and editing the Freddy AI Copilot Overview report.
To view report details, clone, or delete the report:
1. Click the down arrow icon next to the report name. 2. Select the required option and continue.
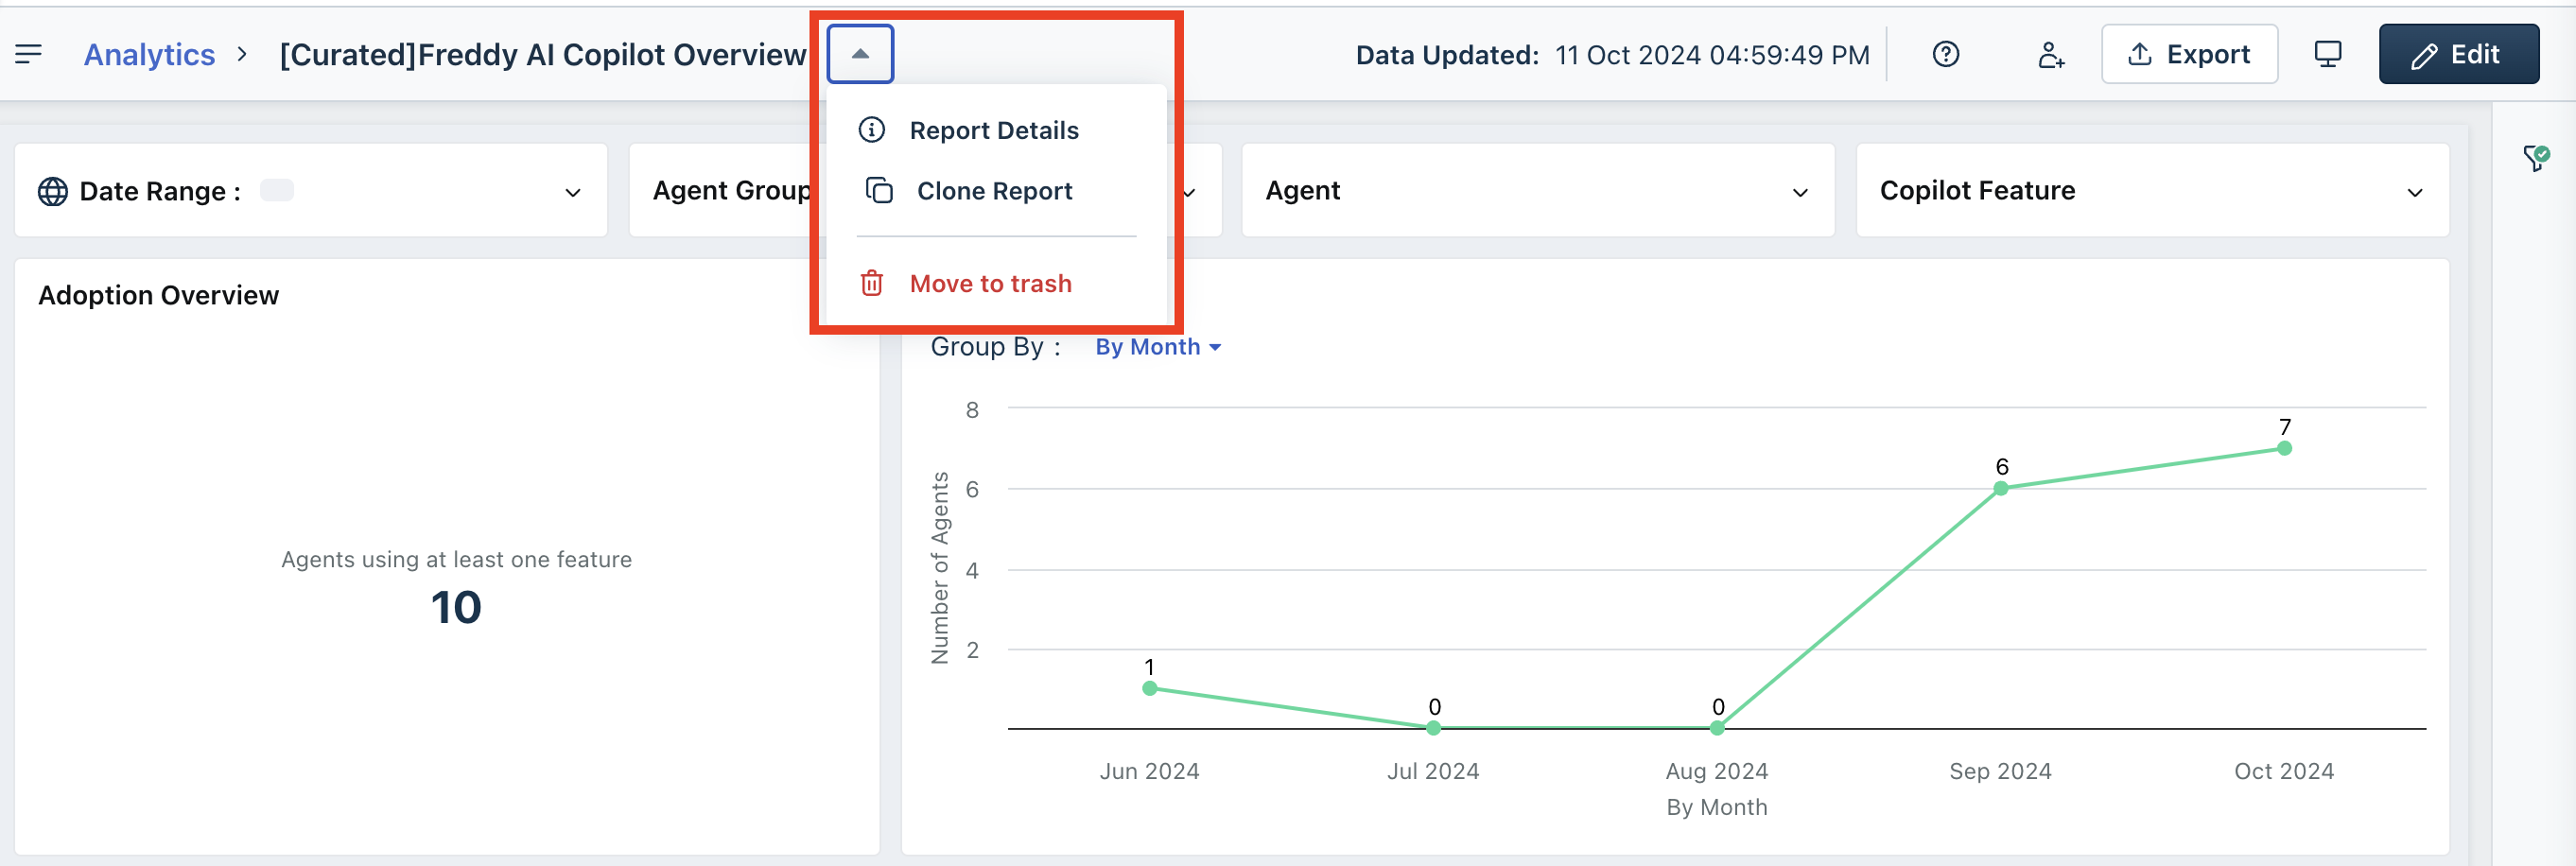
To share, export, or present the report:
You can share the report with users by selecting the view, edit, or manage options.
You can export the report with schedule, subscribe, email, or download options.
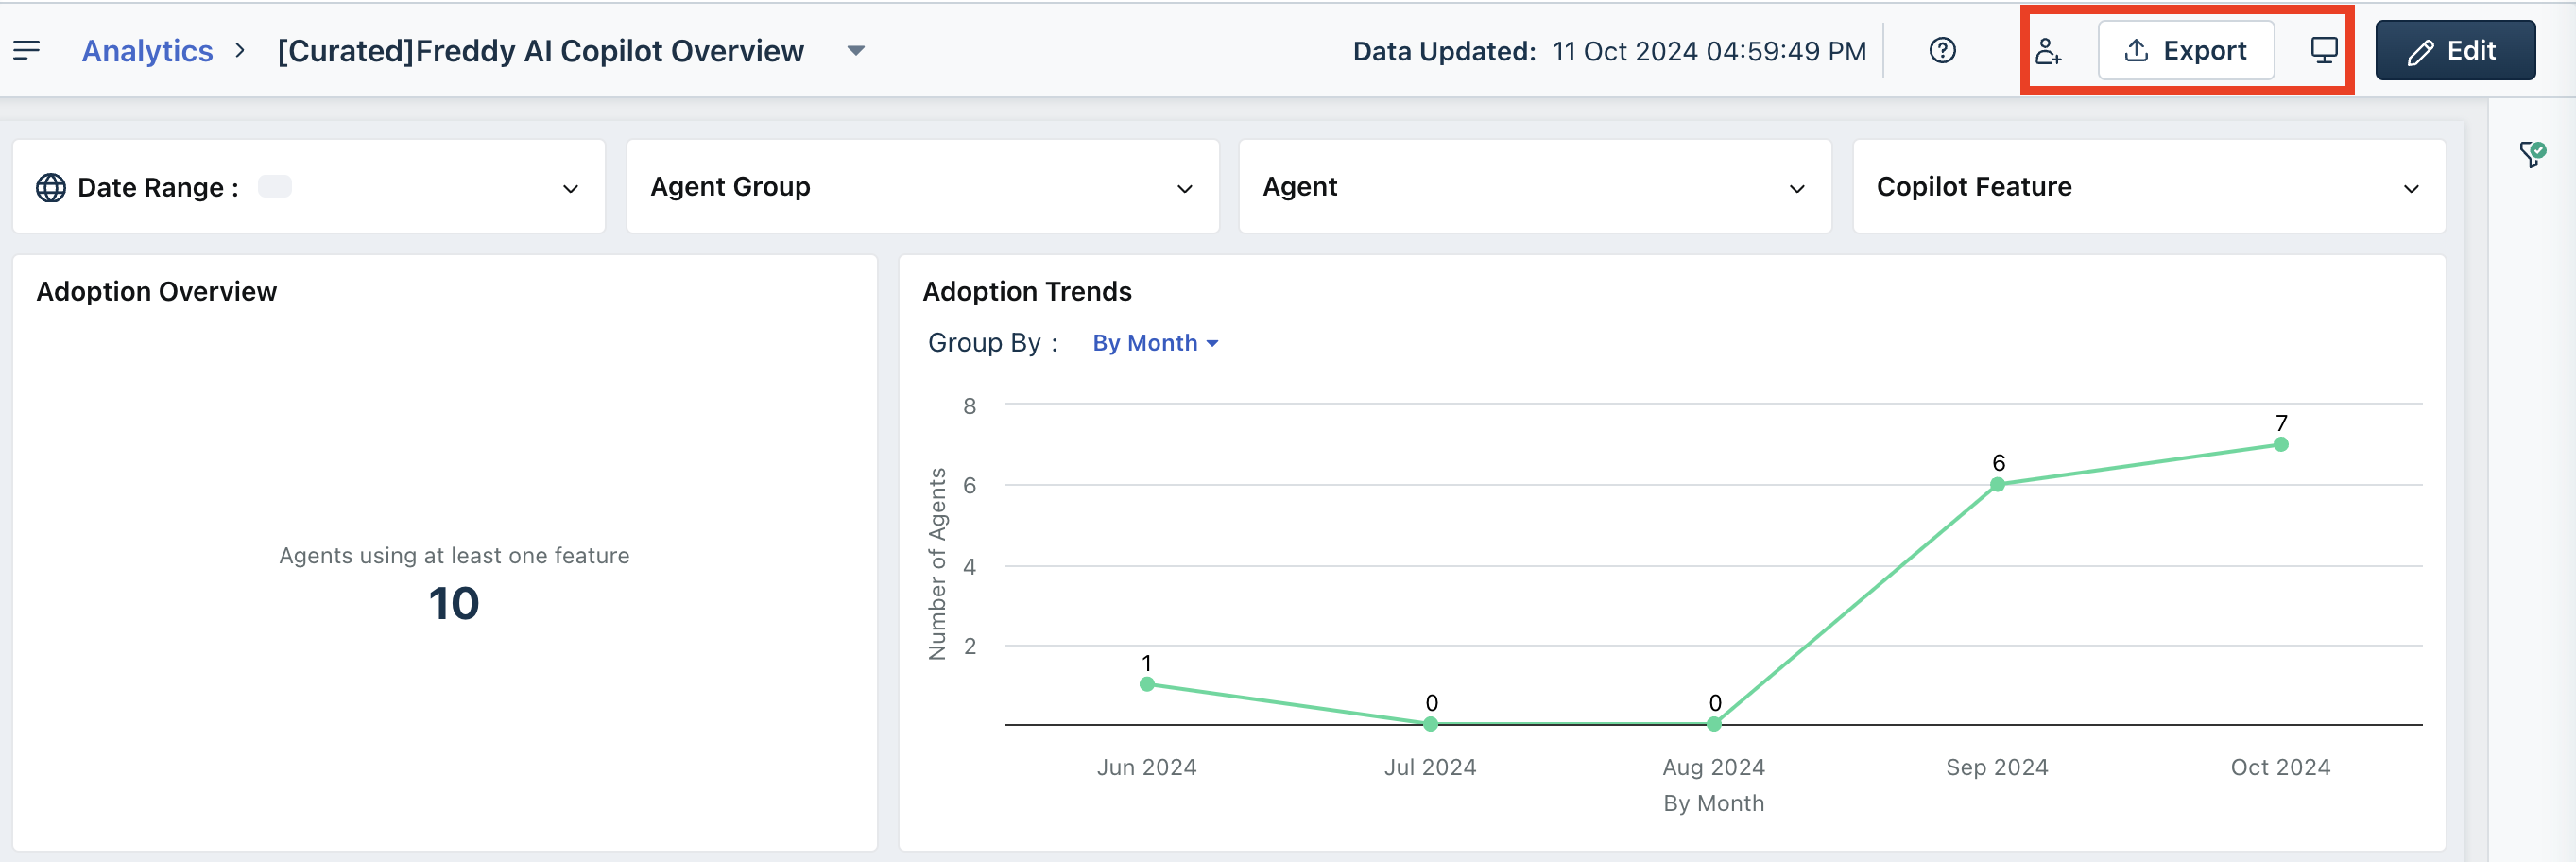
To edit the report:
1\. Click Edit.
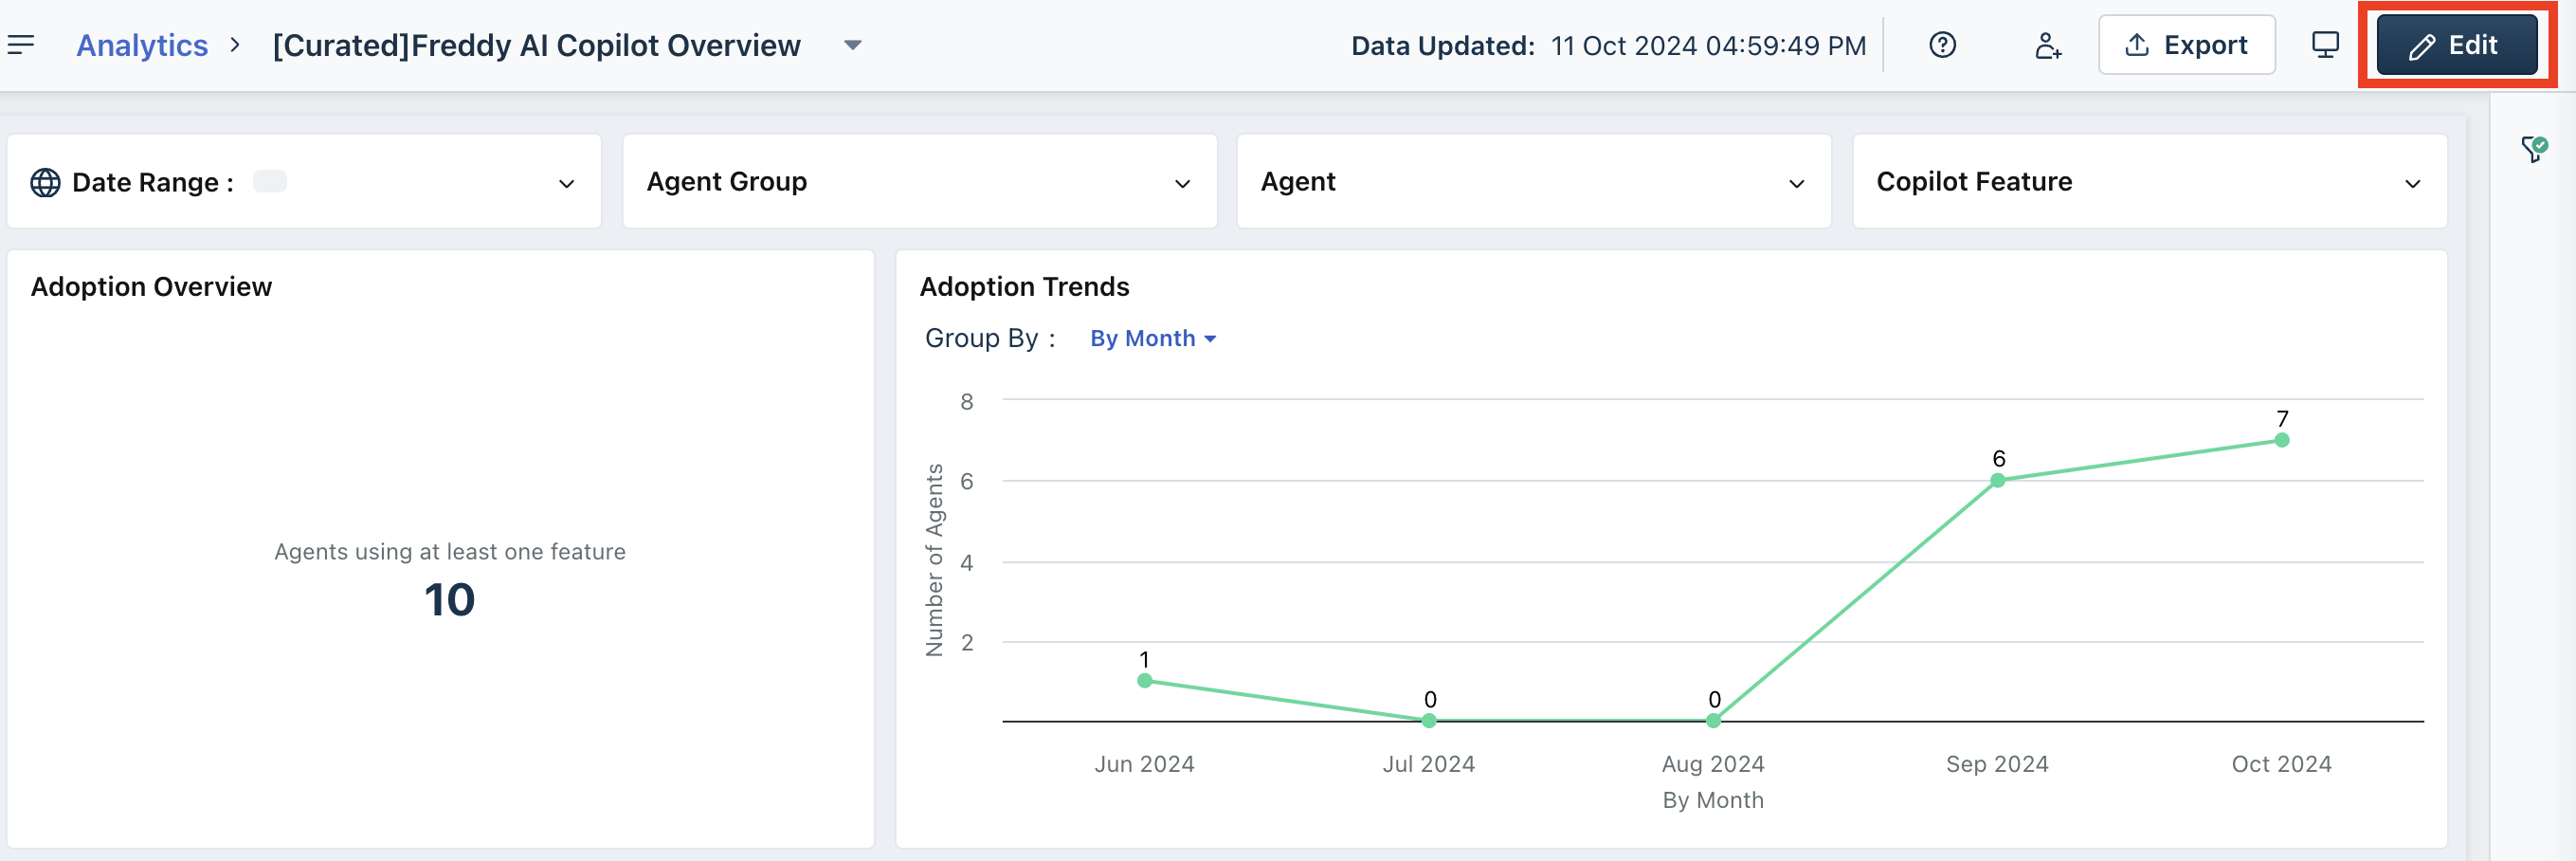
The Report Configuration section opens on the right.
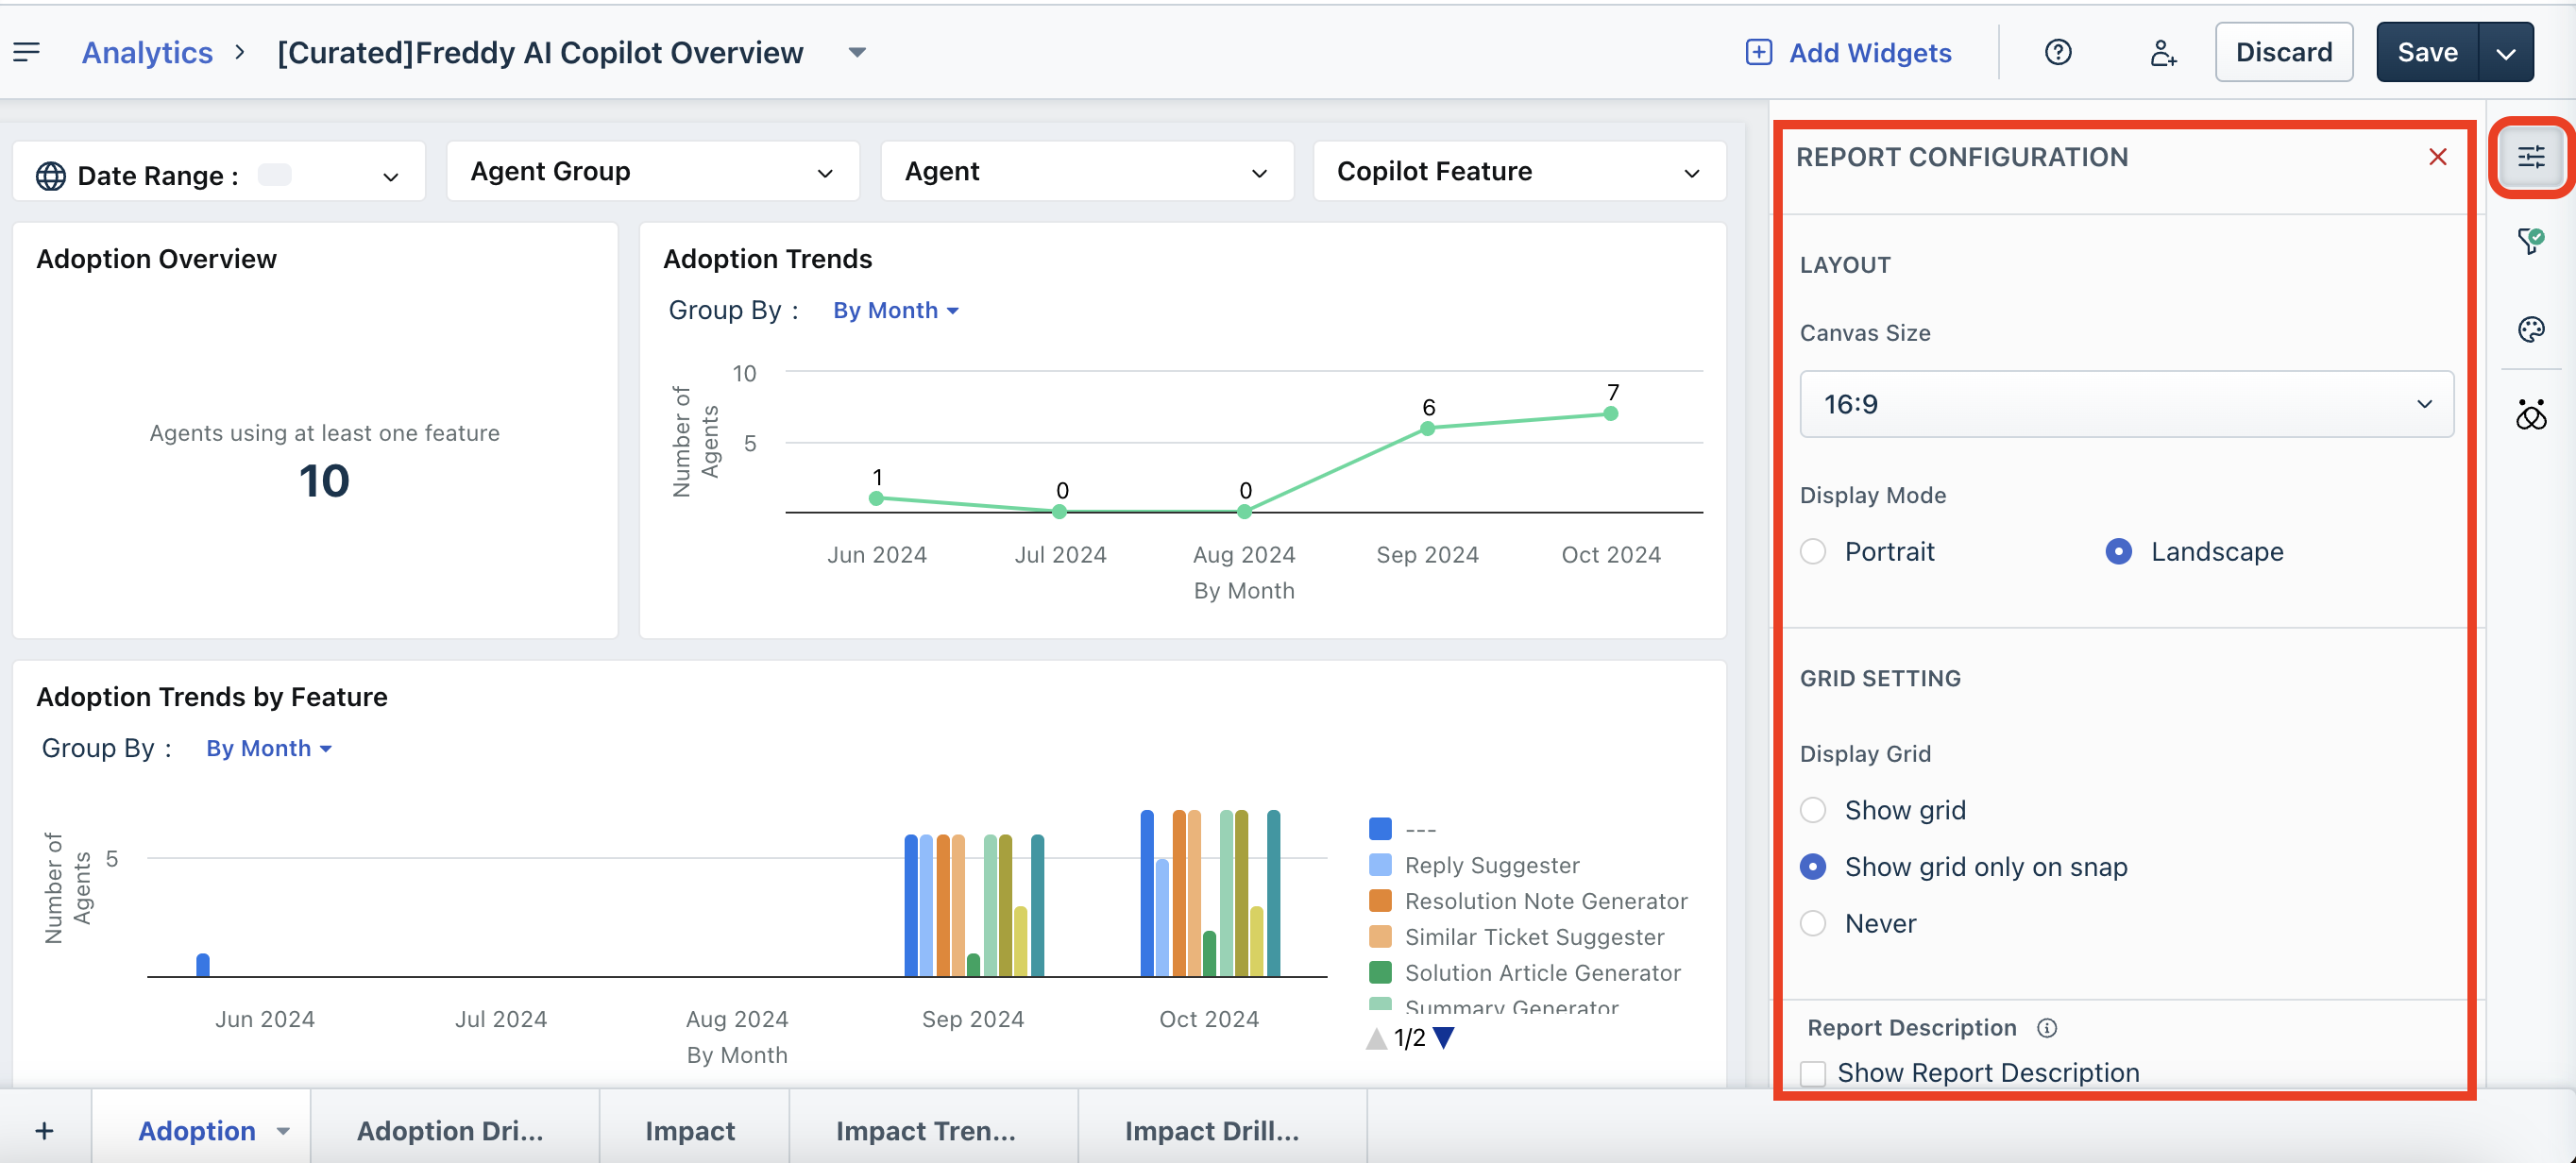
2\. You can configure the layout, grid, and report description settings in the Report Configuration section.
3\. To edit the page and report filters, click the Filters icon on the right.
4\. Modify the filters and click Apply.
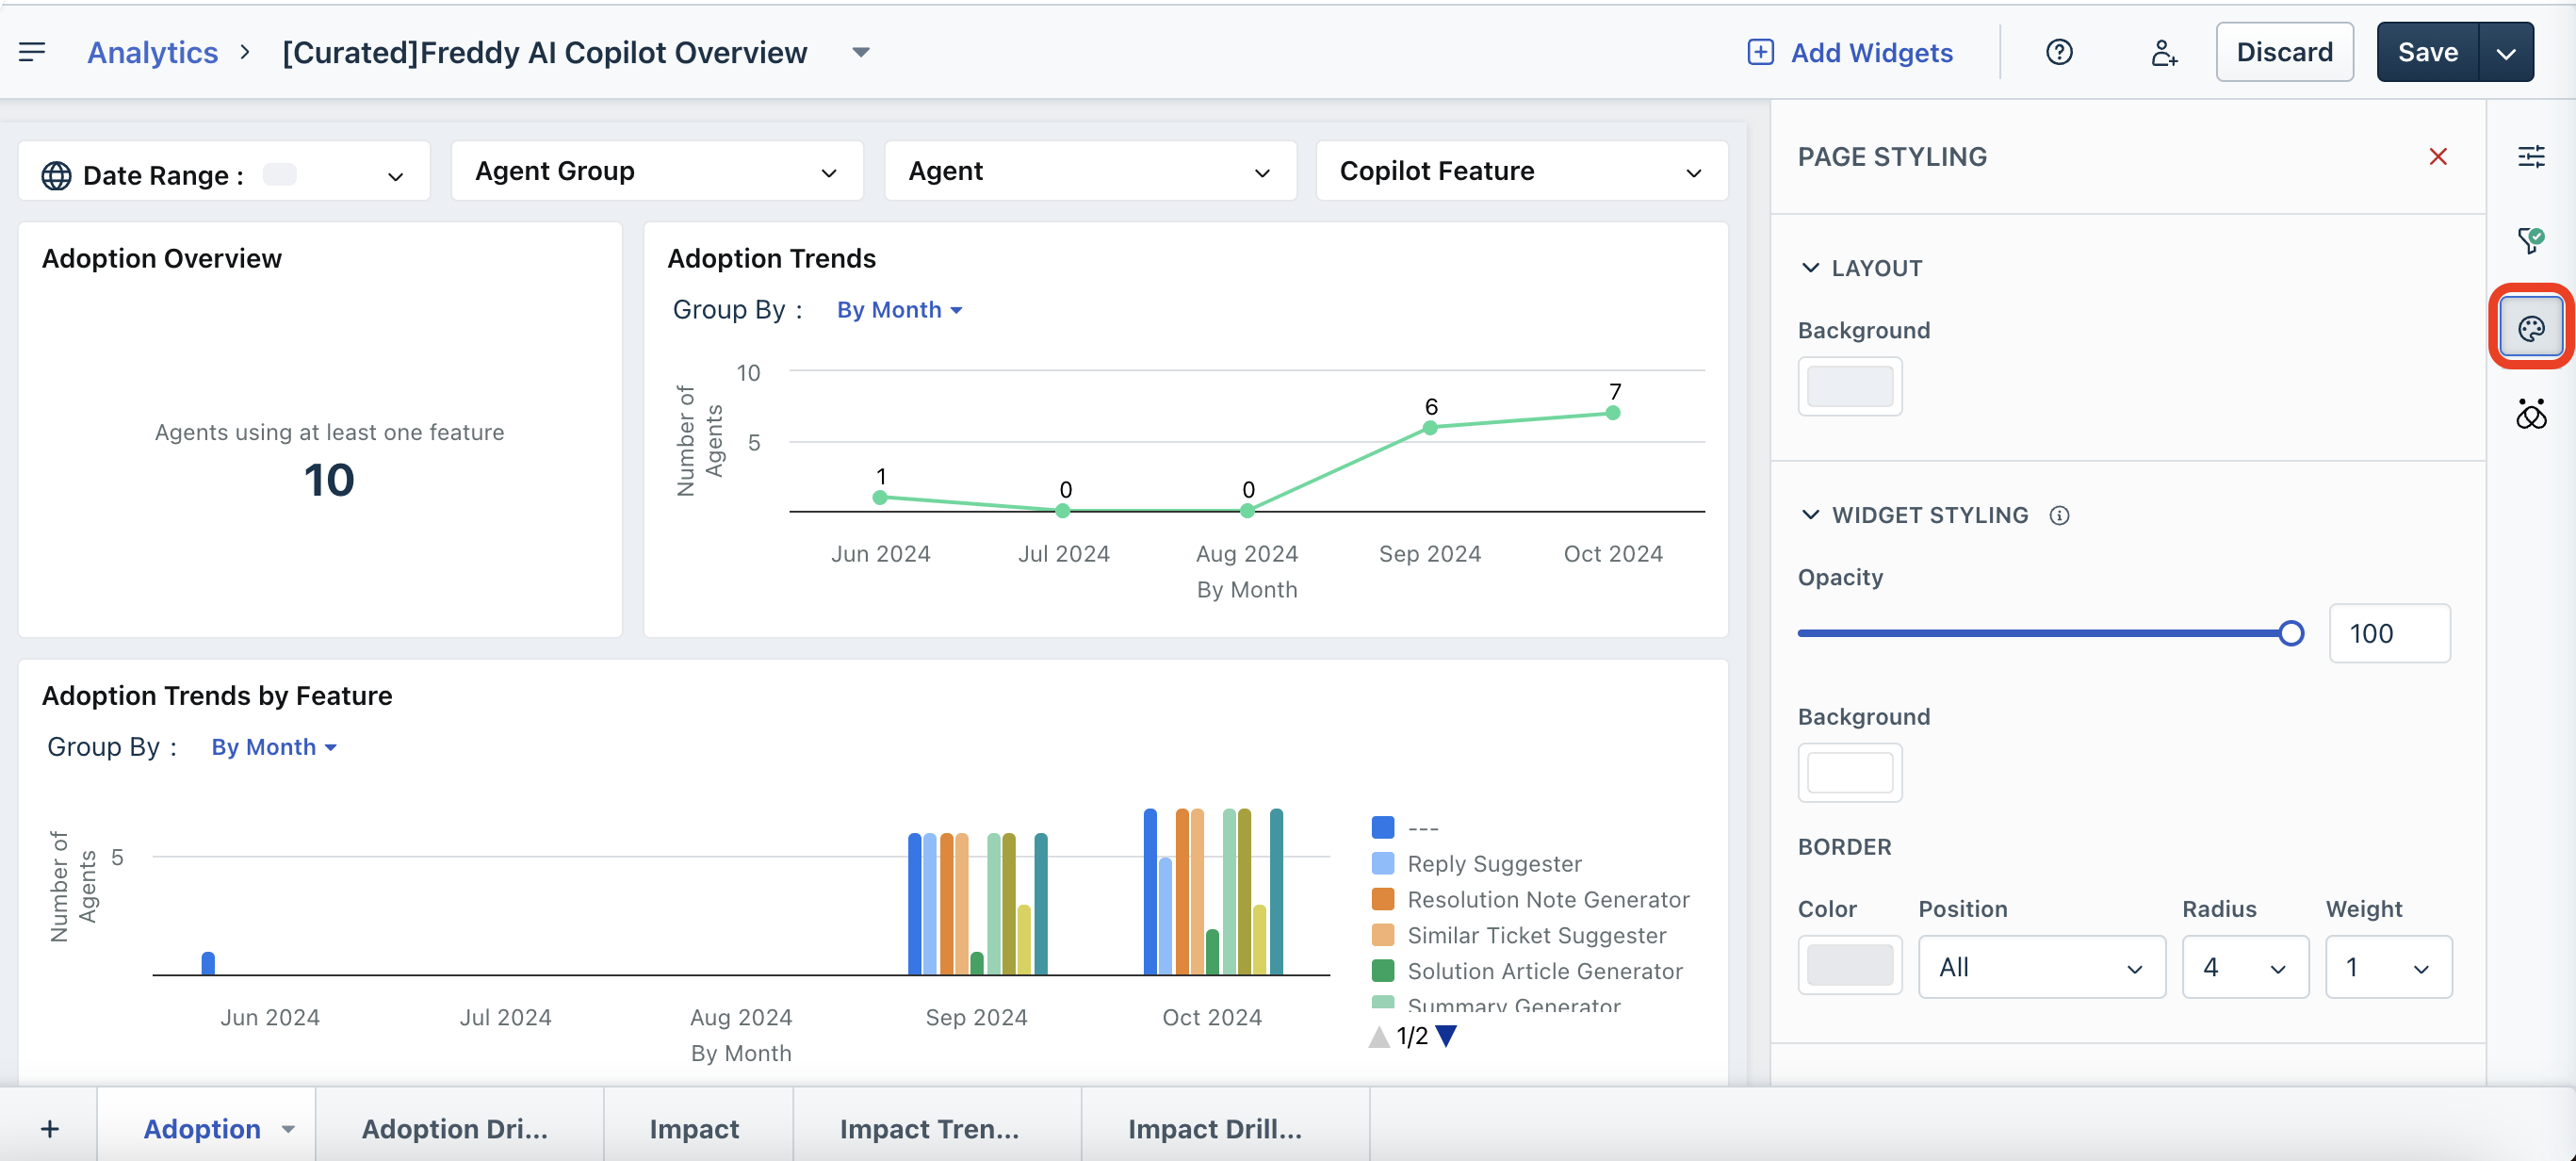
5\. To edit the page styling, such as widget styling or widget header, click the Style icon on the right.
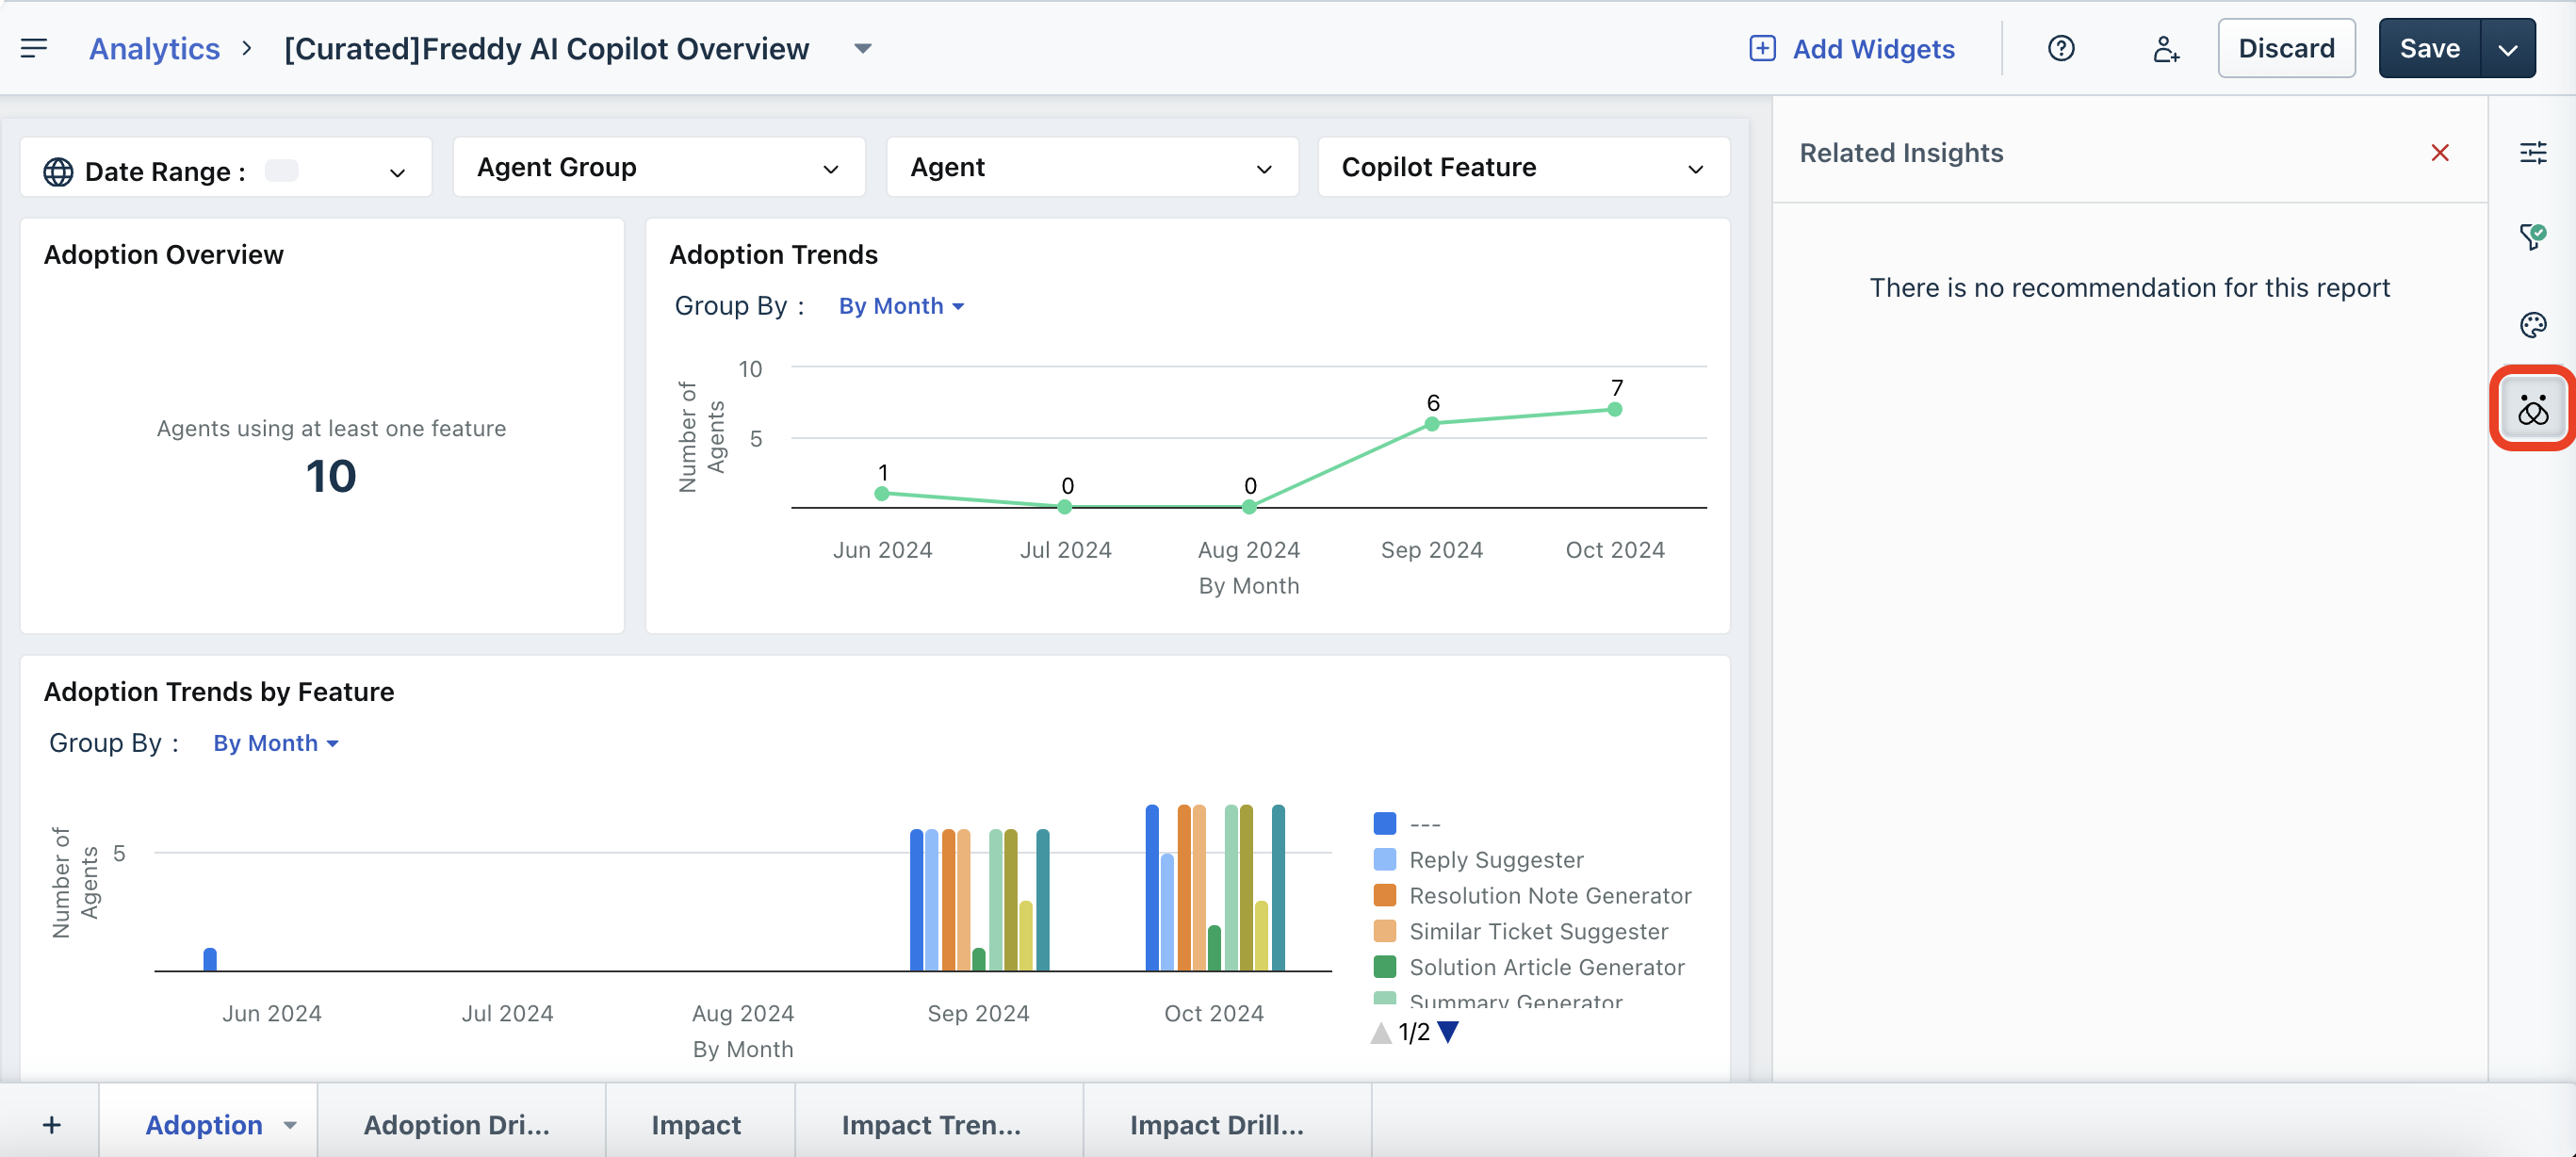
6\. To view related insights, click the Related Insights icon on the right.
7\. After you have edited the report by setting the report configurations, filters, and style; save the report by using the Save or Save As options.
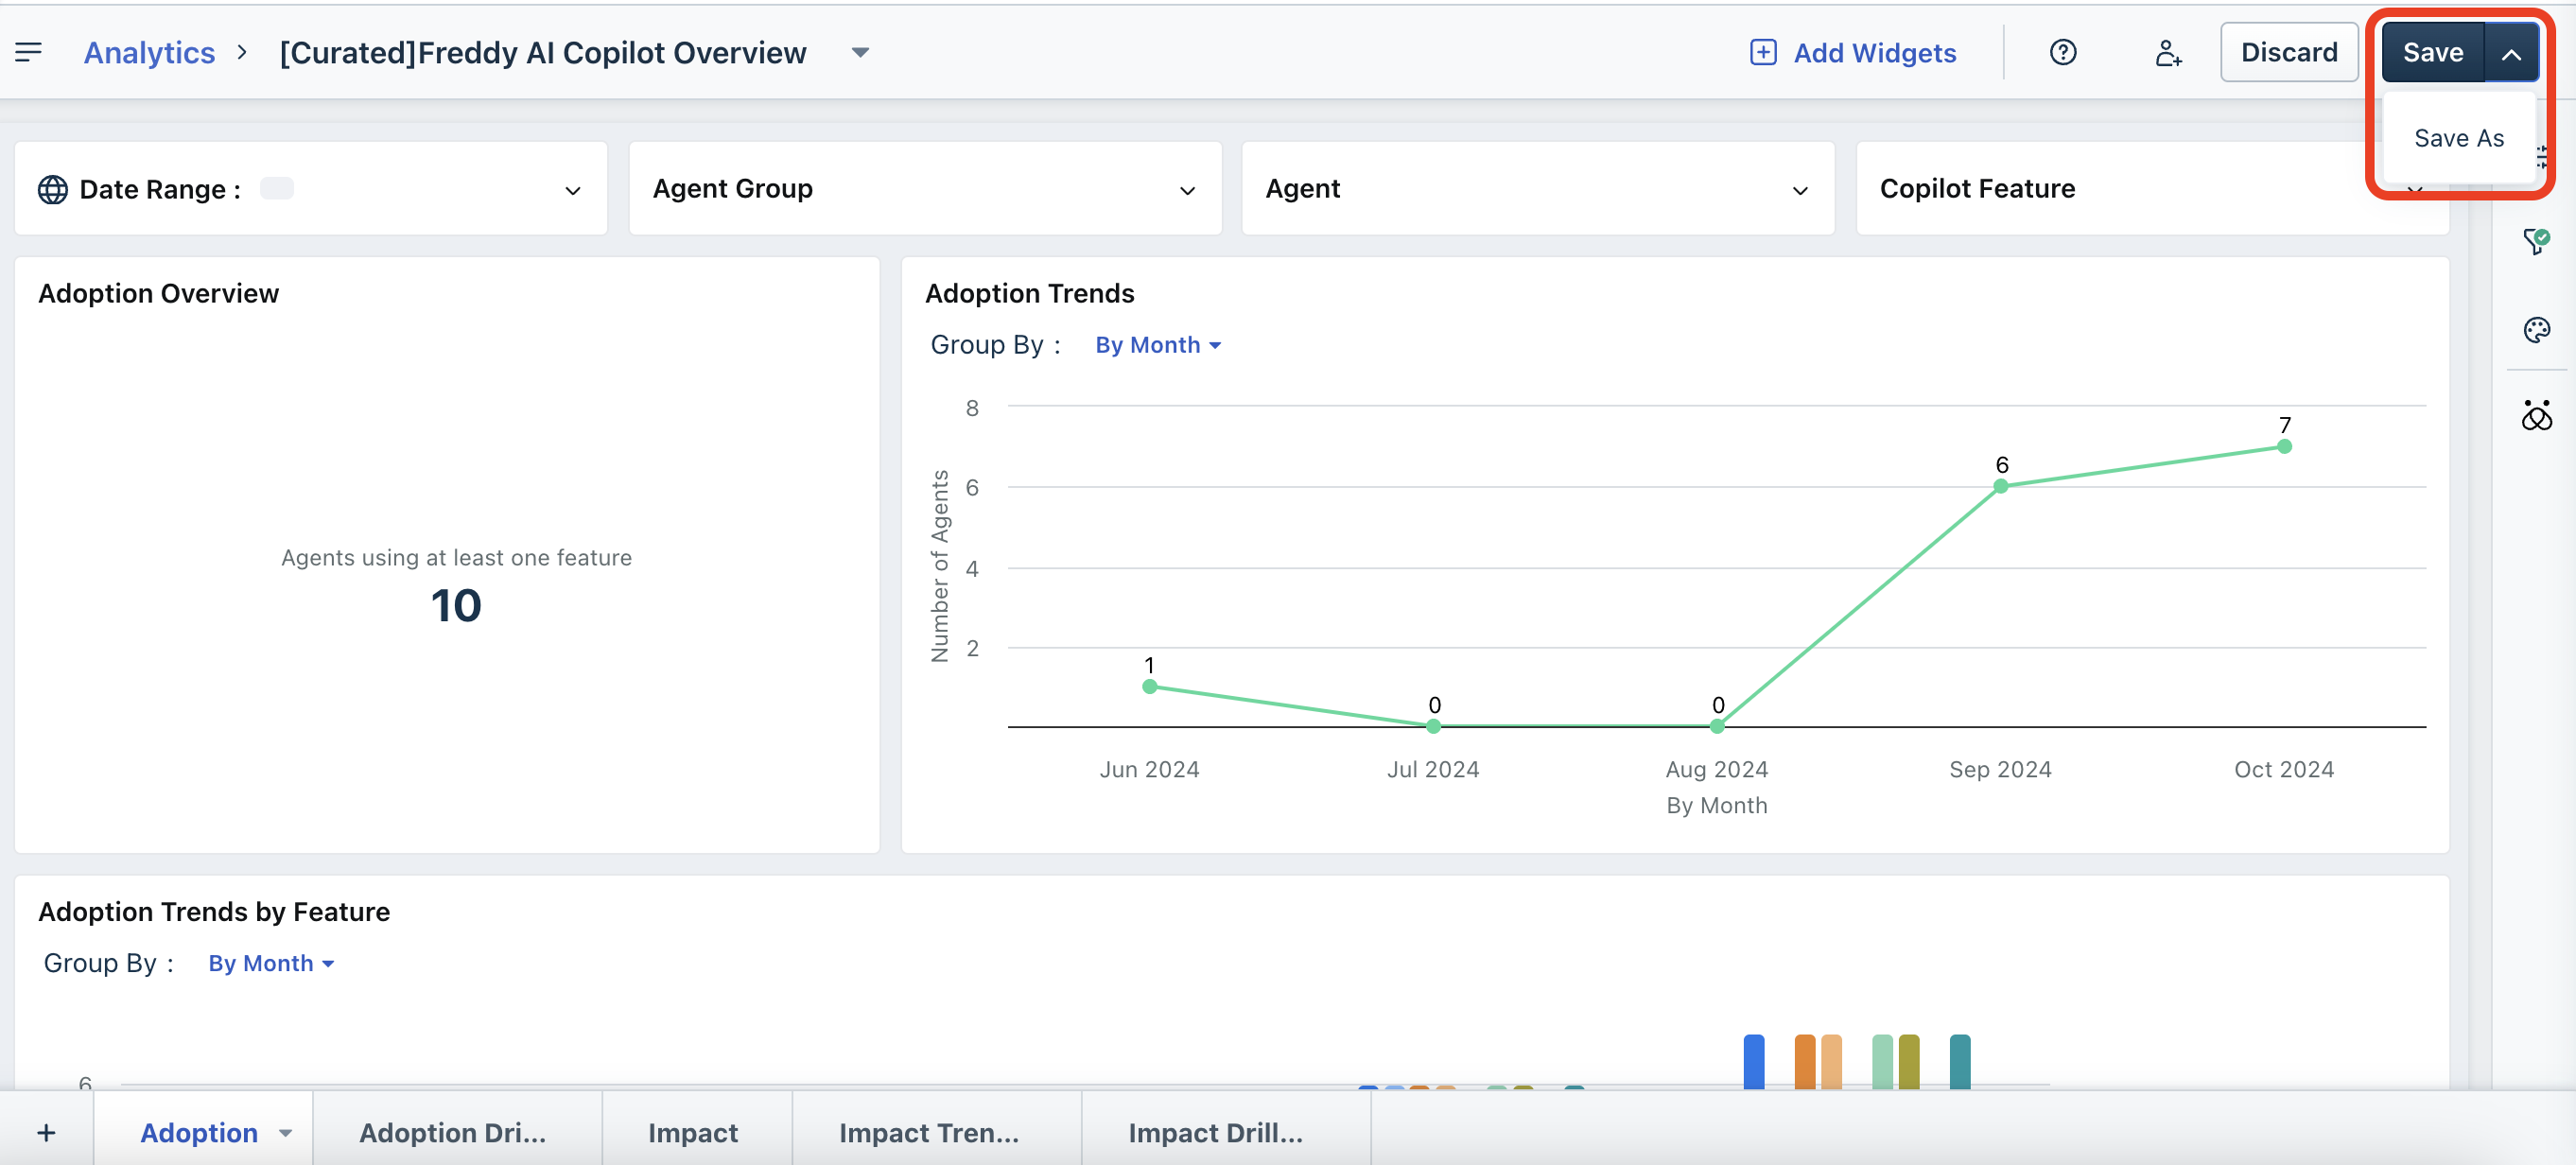
Note: You can discard any changes made to the report by using the Discard option.
Managing widgets and tabs
You can also manage widgets of the report by adding new widgets; or manage tabs/pages of the report by adding new tabs, renaming, or deleting the existing tabs.
To add new widgets:
1\. Click Add Widgets. The Add Widgets section opens on the right.
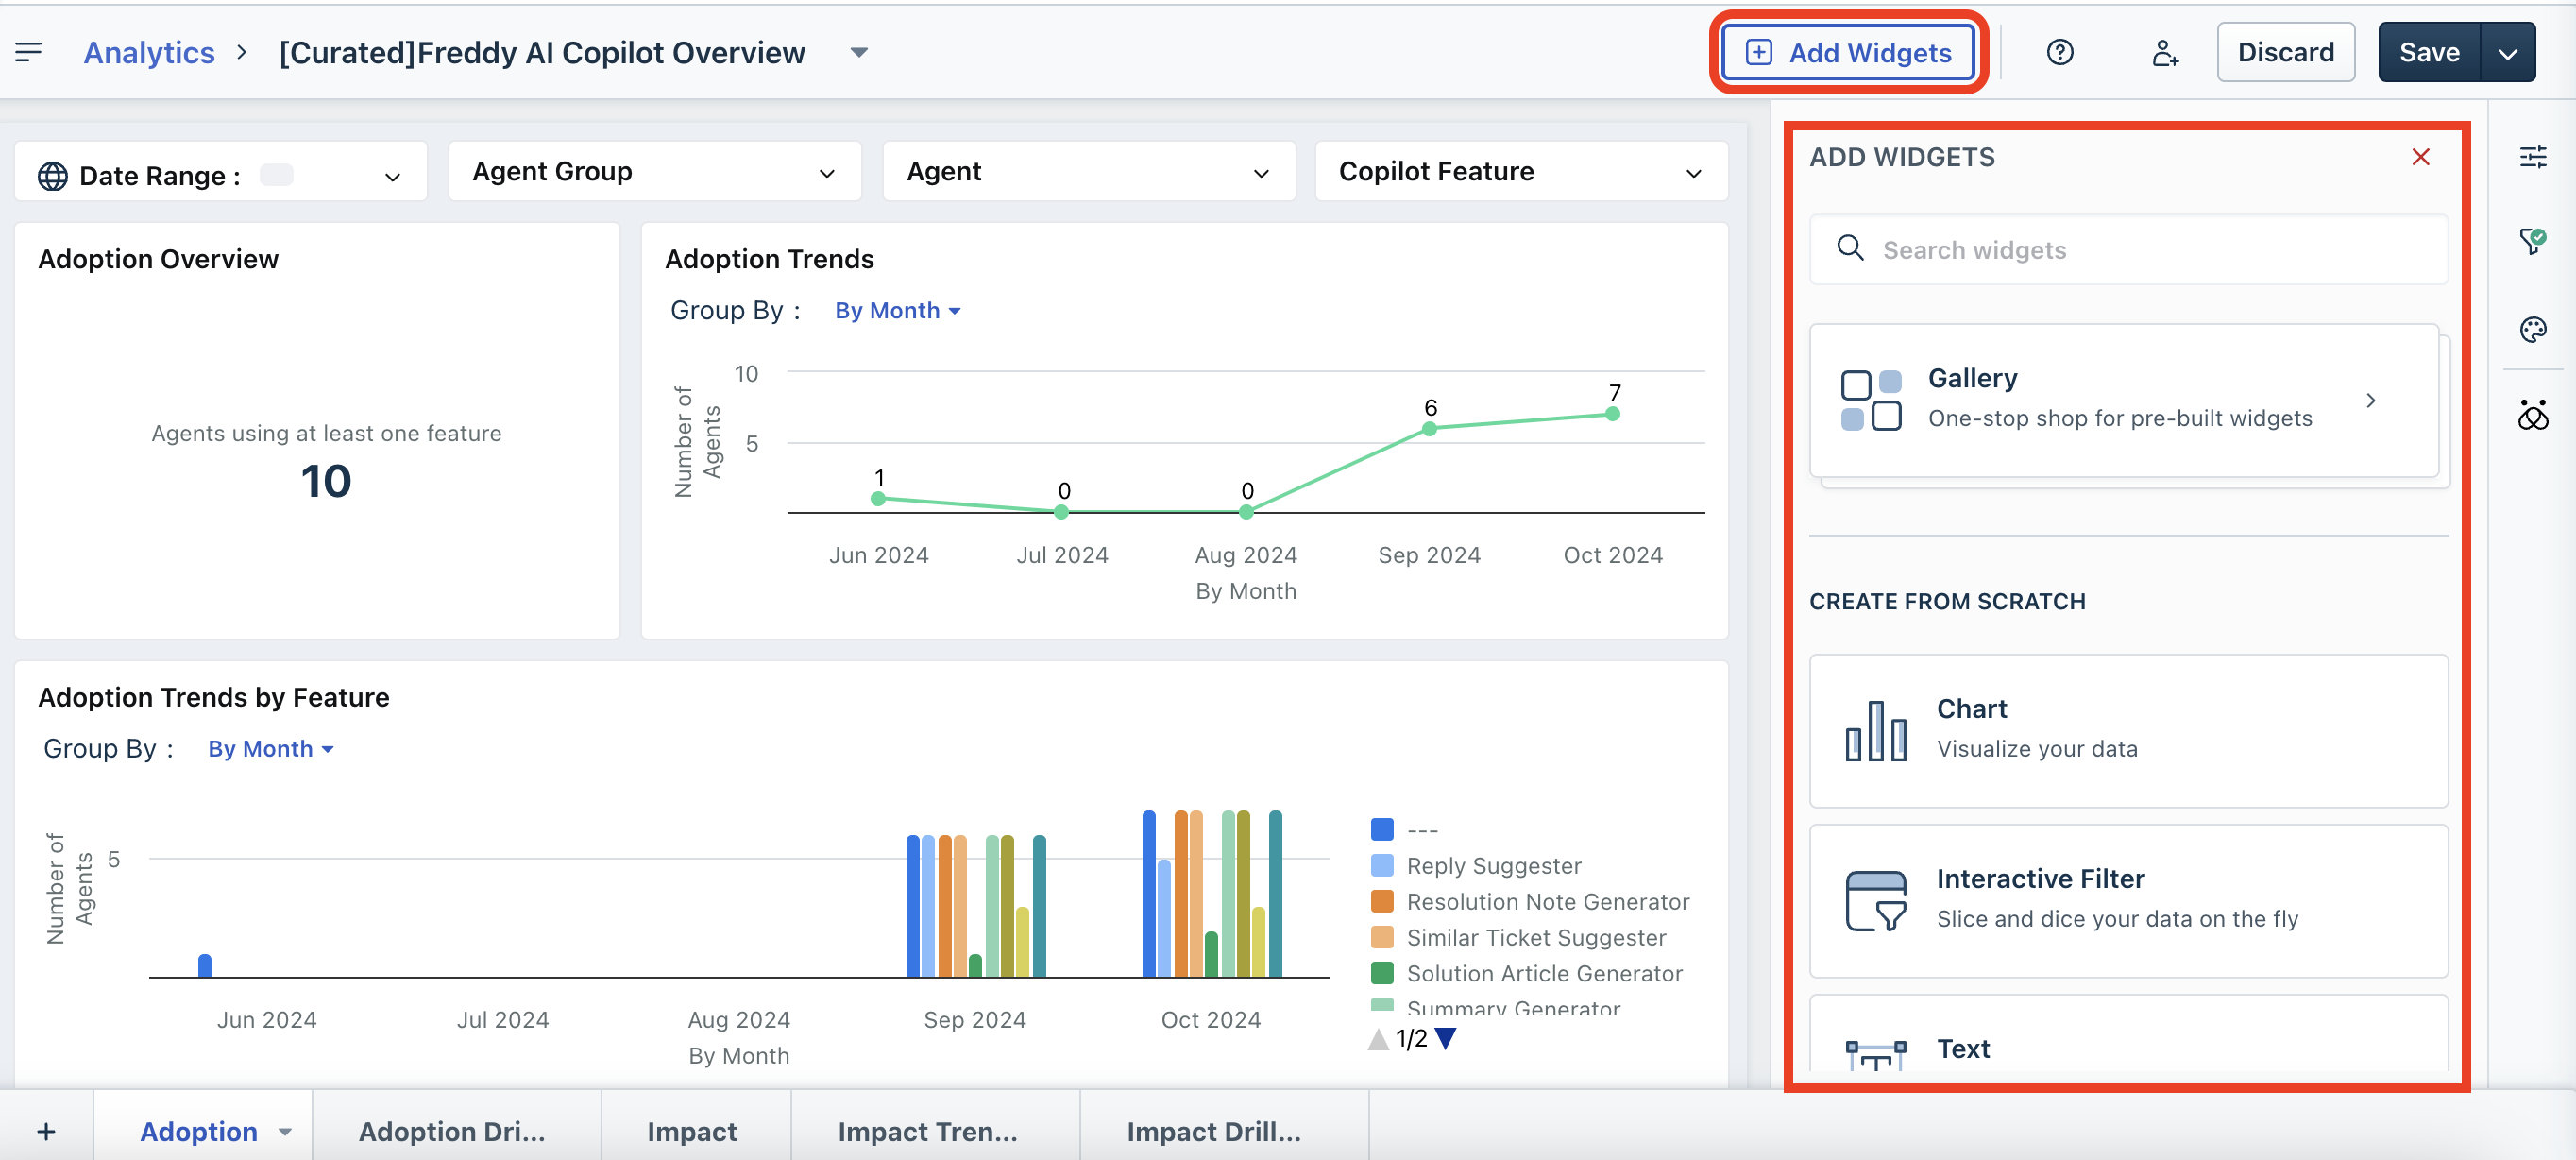
2\. You can search and add widgets with the Search option, or create a widget using chart, interactive filter, text, and images.
To manage tabs/pages of the report:
1\. Use the '+' icon at the bottom to add a new tab/page.
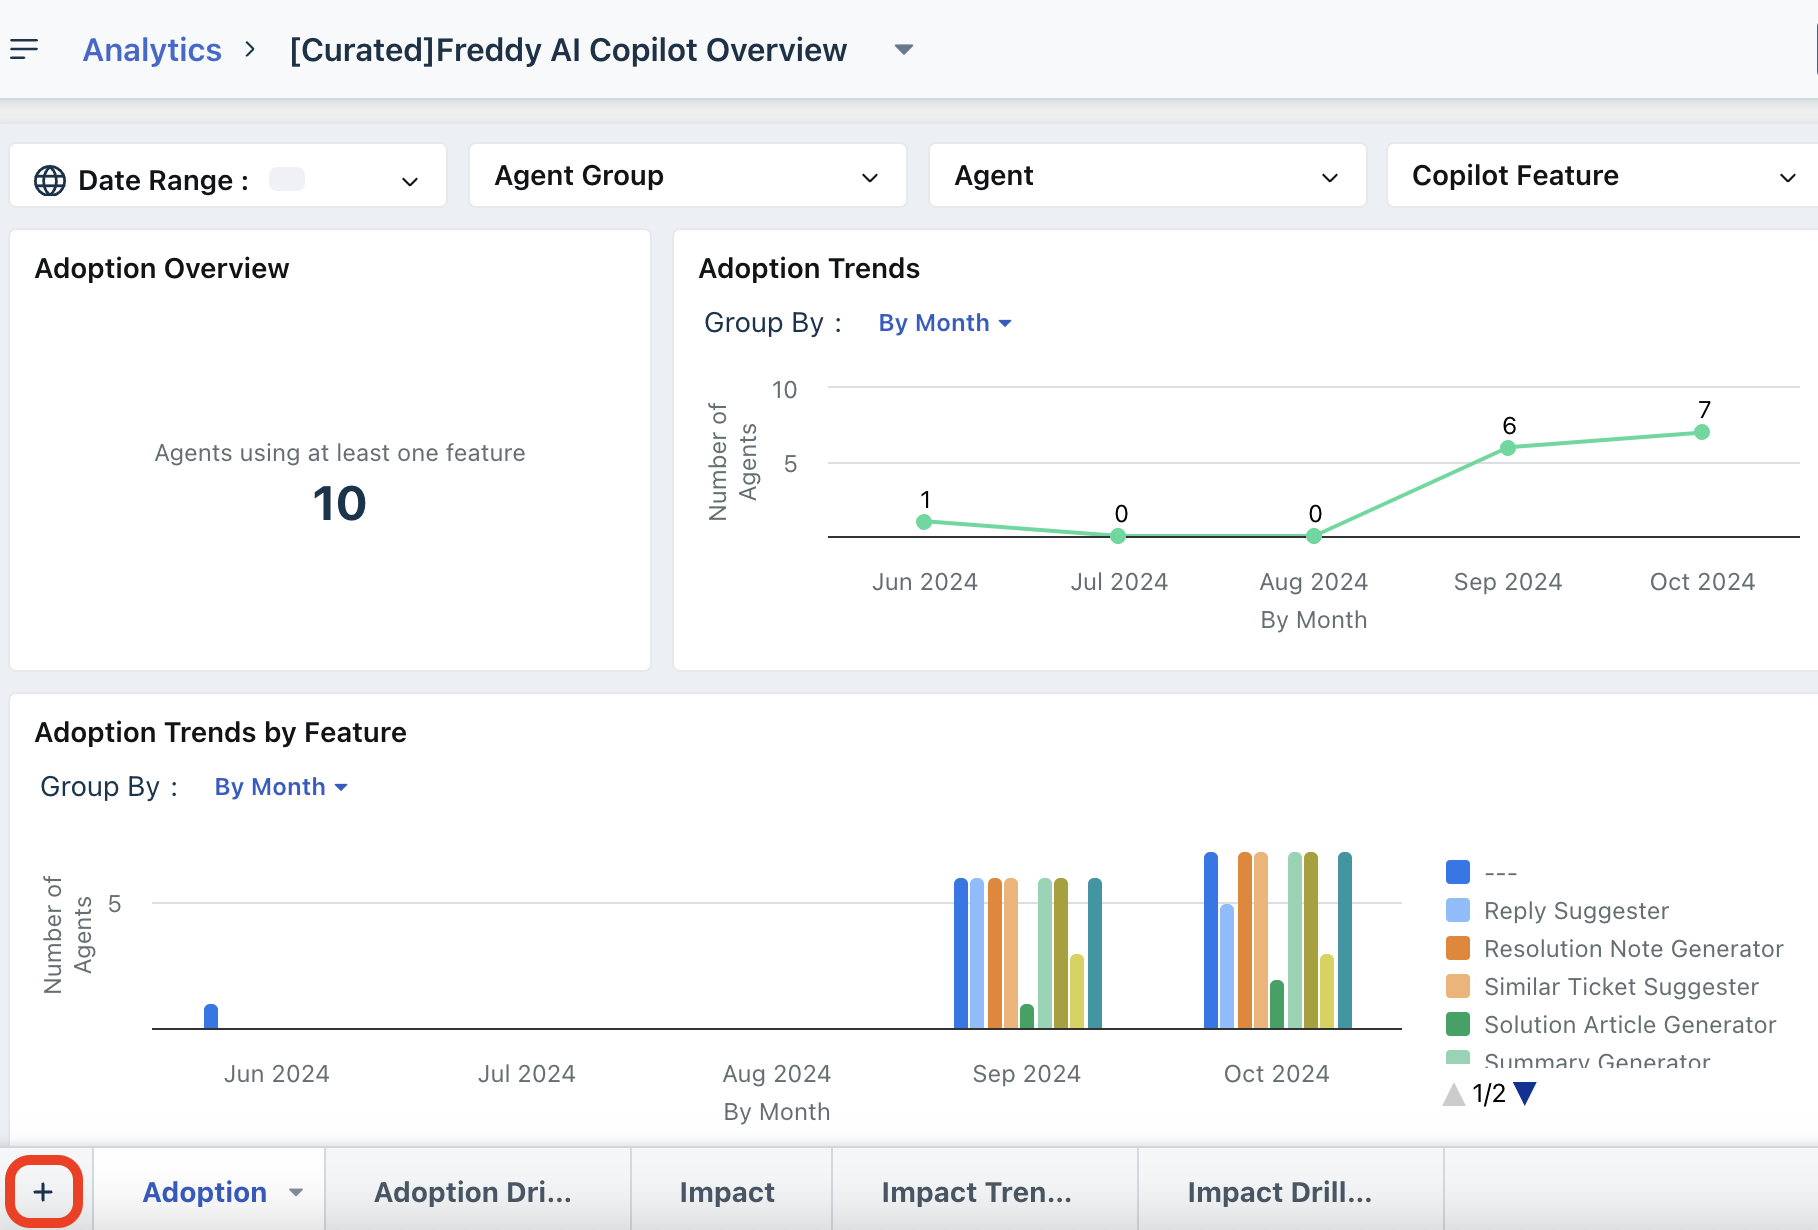
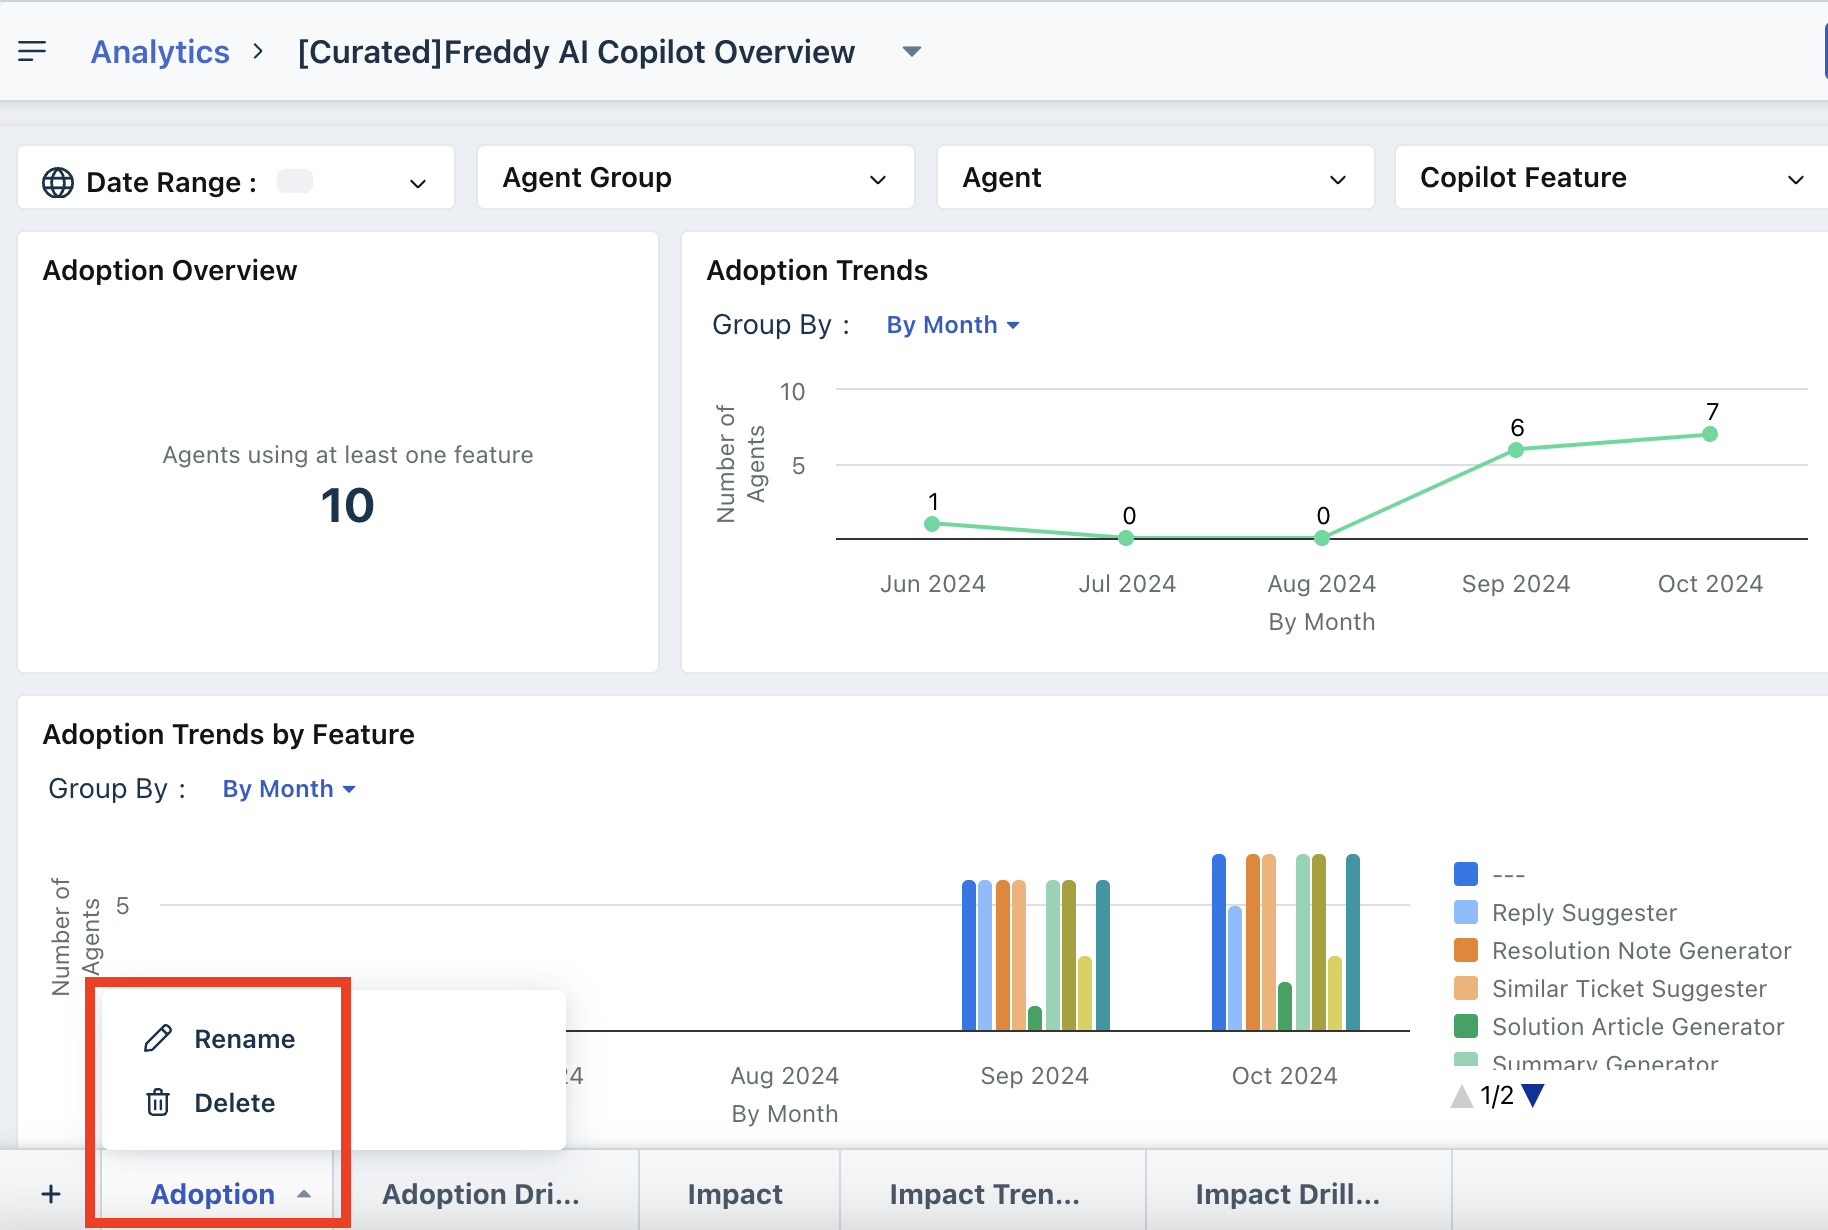
2\. Or, click the down arrow icon corresponding to an existing tab/page.
3\. Then, use the Rename or Delete options to rename or delete the existing tab/page.