Last updated: 2023-06-19
The Group Performance report summarizes the group's effort and performance in the selected time period. You can sort your agent groups based on various metrics like their SLA compliance or the number of private notes they add and find out the best and worst-performing groups.
Metrics split by Group's Effort:
| Metric | Definition | Relationship to the agent |
| Tickets reassigned to group | Number of tickets reassigned to another group in the selected time period | Tickets reassigned from this group to some other group |
| Tickets reopened | Number of tickets reopened in the selected time period | Tickets assigned to the group when reopened |
| Tickets resolved | Number of tickets resolved/closed in the selected time period | Tickets currently assigned to the group |
| Agent reply | Number of replies sent by the agents in the group during the selected time period | Tickets could have been assigned to other agents when responses were sent, tickets can be currently assigned to other agents/groups |
| Public notes | Number of public notes added by the agent during the selected time period | Tickets could have been assigned to other agents when note was added, tickets can be currently assigned to other agents |
| Private notes | Number of private notes added by the agent during the selected time period | Tickets could have been assigned to other agents when note was added, tickets can be currently assigned to other agents |
| Agent Responses (Agent Interactions) | Total number of responses & public notes added by the agent during the selected time period | Tickets could have been assigned to other agents when responses were sent, tickets can be currently assigned to other agents |
| Tickets assigned to group | Number of tickets assigned in the selected time period | Tickets currently assigned to the group |
Metrics split by Groups' Performance:
| Metric | Definition | Relationship to the agent |
| Tickets resolved within SLA % (Resolution SLA %) | Percentage of the number of tickets resolved within the SLA | Tickets currently assigned to the group |
| Tickets first responded within<br>SLA % (First response SLA %) | Percentage of the number of tickets for which the first response has been sent within the SLA | Event performing agent |
| Tickets resolved within FCR SLA %(First contact resolution SLA %) | Percentage of the number of tickets resolved within SLA with just one agent response | Tickets currently assigned to the agent |
| Average resolution time in Business hours | Average time taken to resolve/close a ticket in the selected time period - \[created time + non-business hours\] | Tickets currently assigned to the agent |
| Average response time | Average time taken by the group to respond to the requester during the selected time period | Tickets could have been assigned to other agents when responses were sent, tickets can be currently assigned to other agents |
| Average first response time in Business hours | Average time taken by the group to send the first response during the selected time period - \[created time + non-business hours\] | Tickets could have been assigned to other agents when first responses were sent, tickets can be currently assigned to other agents |
| Average first assign time in Business hours | Average time taken to first-assign the ticket to a group - \[created time + non-business hours\] | First-assigned agent |
| Average first assign time in Calendar hours | Average time taken to first-assign the ticket to a group - \[created time\] | First-assigned agent |
| Average resolution time in Calendar hours | Average time taken to resolve/close a ticket in the selected time period - \[created time\] | Tickets currently assigned to the agent |
You can filter the group performance report based on various ticket properties. This will help you understand how your groups are performing when it comes to high-priority tickets or which group is good at handling what type of tickets.
Ticket drill-down
Click on any widget in the report for a detailed drill-down of tickets in the specified time period.
Below the graph, expand the ' Show Tabular Data' accordion to see the underlying raw data that fuels it. It will bring up a list of tickets that are associated with the chosen widget. You can use the gear button to select the various fields and properties you want to be added as columns to the table. The 'Ticket ID' column will give you the list of ticket IDs along with a link that will take you to the ticket.
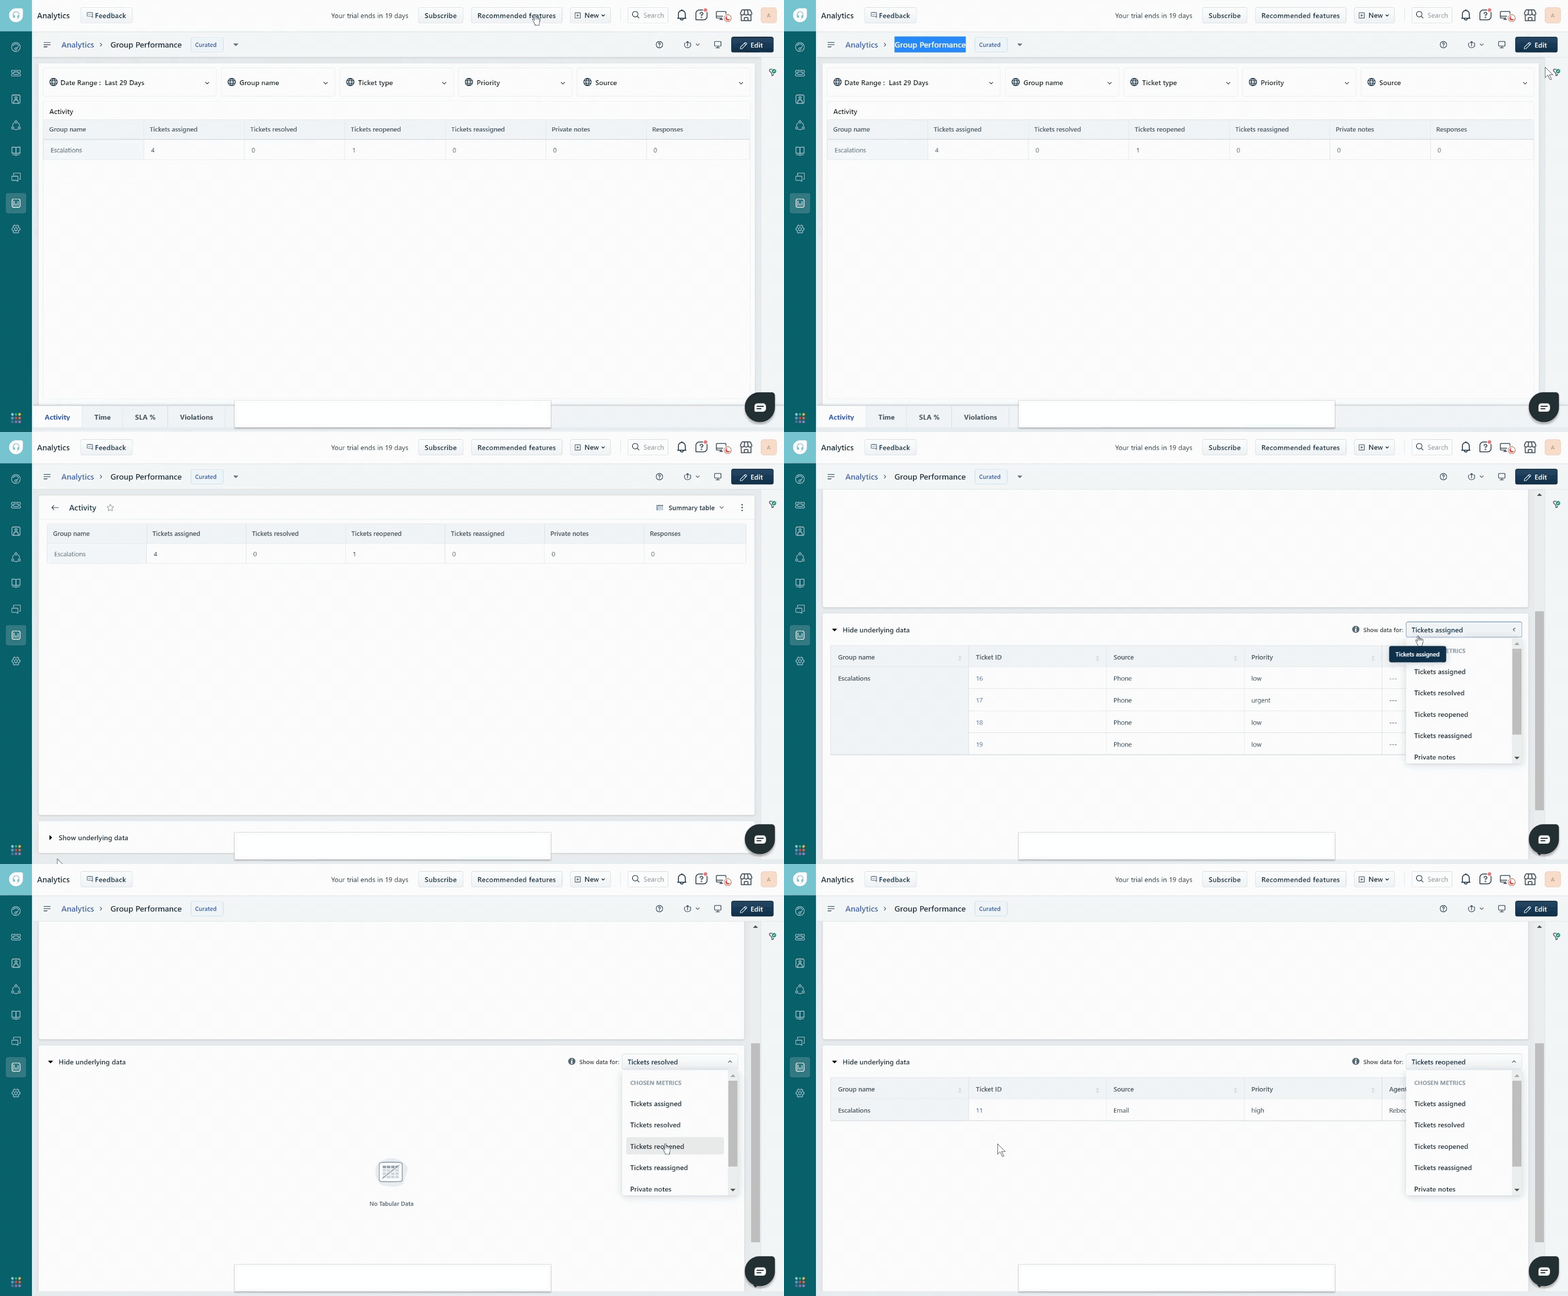
For example, if you click on ' Show Tabular Data' under the ' Tickets created split by source' widget, you will be able to see all the tickets created via the various sources during the selected time period. If you see an abnormal spike for a specific source, you can find out what is causing it and take necessary actions.
Custom drill-down _(Pro+/ Previously Estate +)_
Click on any data point in your graph and a group-by drill-down will pop up. You can now dissect it by any dimension of your choice.
For example, in the 'Created tickets split by source' widget, the tickets coming in via the ' feedback widget' alone are grouped by the FCR resolution. This will help identify the number of feedback widget queries addressed within FCR time.

``` Note: If your helpdesk's SLA policy is associated with Business hours, then all these metrics would be calculated based on the Business hour configuration (under Admin > Business Hours) only. ```